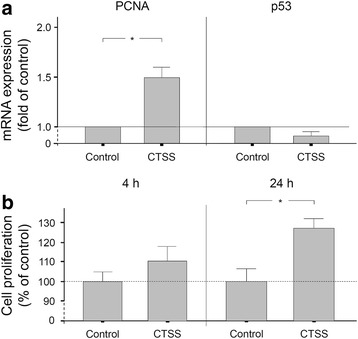
Fig. 3.

a PCNA and p53 gene expressions in the presence or absence of CTSS (1 ng/μl) at 24 h. Mean ± SEM (n = 9), * significant (p < 0.05) difference between groups. b PDL cell proliferation in the presence or absence of CTSS (1 ng/μl) at 4 h and 24 h. Mean ± SEM (n = 24), * significant (p < 0.05) difference between groups
