Fig. 2.

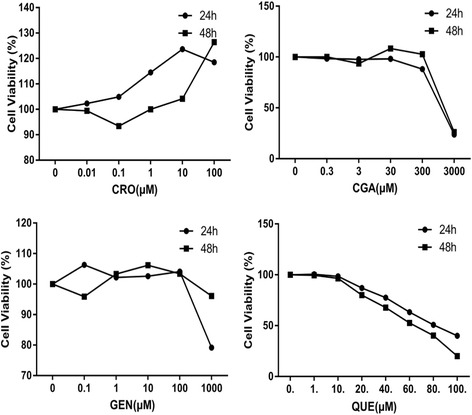
The effects of different concentrations of CRO, CGA, GEN and QUE on the viability of HepG2 cells for 24 h or 48 h. Data are expressed as mean ± SEM from at least five independent experiments

The effects of different concentrations of CRO, CGA, GEN and QUE on the viability of HepG2 cells for 24 h or 48 h. Data are expressed as mean ± SEM from at least five independent experiments