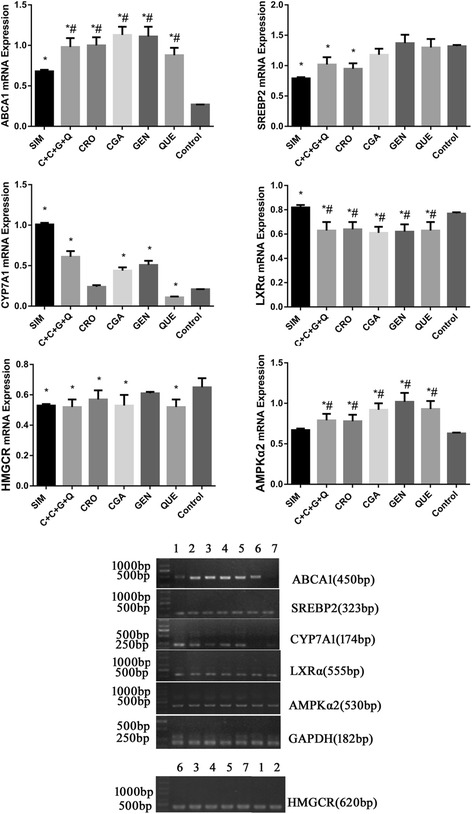
Fig. 4.

mRNA expression levels of the regulation cholesterol activities associated genes ABCA1, SREBP2, CYP7A1, LXRα, AMPKα2 and HMGCR in HepG2 cells. All genes were normalized with GAPDH. HepG2 cells were treated with (1) SIM (10 μmol/L), (2) C + C + G + Q (1 μmol/L + 30 μmol/L + 10 μmol/L + 10 μmol/L) (3) CRO (1 μmol/L), (4) CGA (30 μmol/L), (5) GEN (10 μmol/L), (6) QUE (10 μmol/L) and no drug for (7) Control respectively for 48 h. Data represent as mean ± SEM of three independent experiments. *P < 0.05 vs. control, #P < 0.05 vs. SIM
