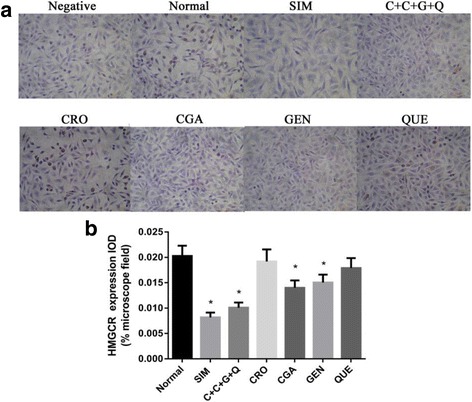
Fig. 5.

Expression of HMGCR in HepG2 cells. a Representative immunocytochemical images of HMGCR expression in cells. HepG2 cells were treated with SIM (10 μmol/L), C + C + G + Q (1 μmol/L + 30 μmol/L + 10 μmol/L + 10 μmol/L), CRO (1 μmol/L), CGA (30 μmol/L), GEN (10 μmol/L) and QUE (10 μmol/L) for 48 h respectively, and treated with PBS instead of the primary antibody of HMGCR for negative control, and with no drug for normal control. The brown granules in the cytoplasm represent HMGCR positive staining results. b The bar chart showing the comparison of the IOD for HMGCR expression in cells. Data represent as mean ± SEM of three independent experiments. *P < 0.05 vs. control, #P < 0.05 vs. SIM
