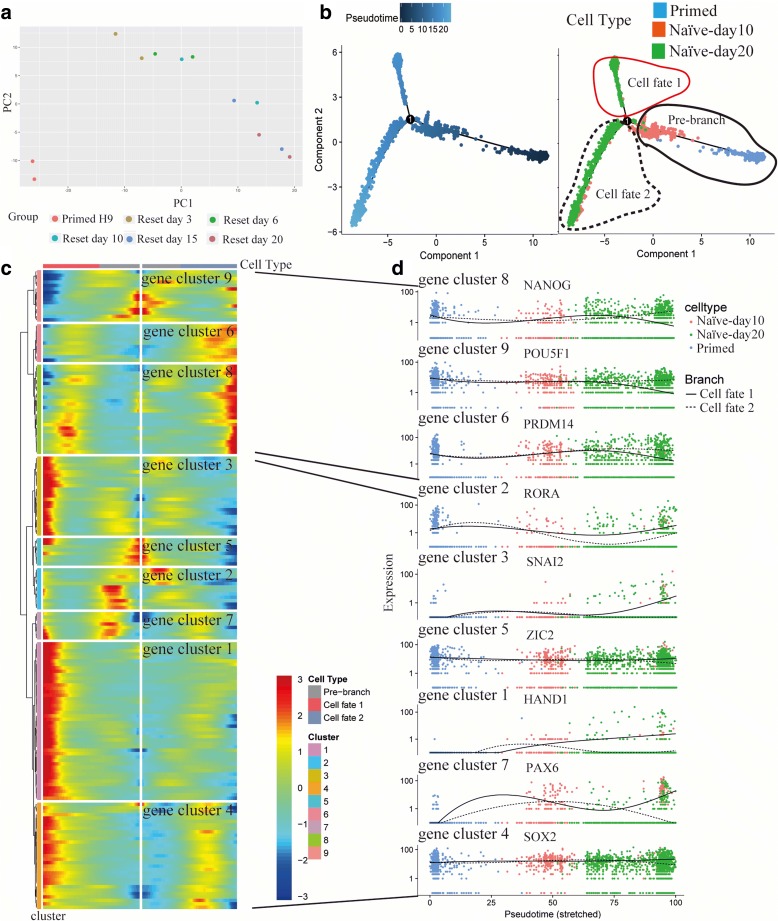
Fig. 6.
Construction of naïve hPSC reset trajectory by pseudotime analysis. a PCA analysis of bulk RNA-seq shows the correlation of hPSCs with different states. Reset H9 was sampled at day 3, day 6, day 10, day 15, and day 20. b H9 reset trajectory constructed by Monocle. c Heatmap shows TFs expression dynamics during the cellular-state transition process. Genes (row) are clustered and cells (column) are ordered according to the pseudotime development. Genes are listed in Additional file 9: Table S8. d TFs expression dynamics. Full line: cell fate 1; Imaginary line: cell fate 2

