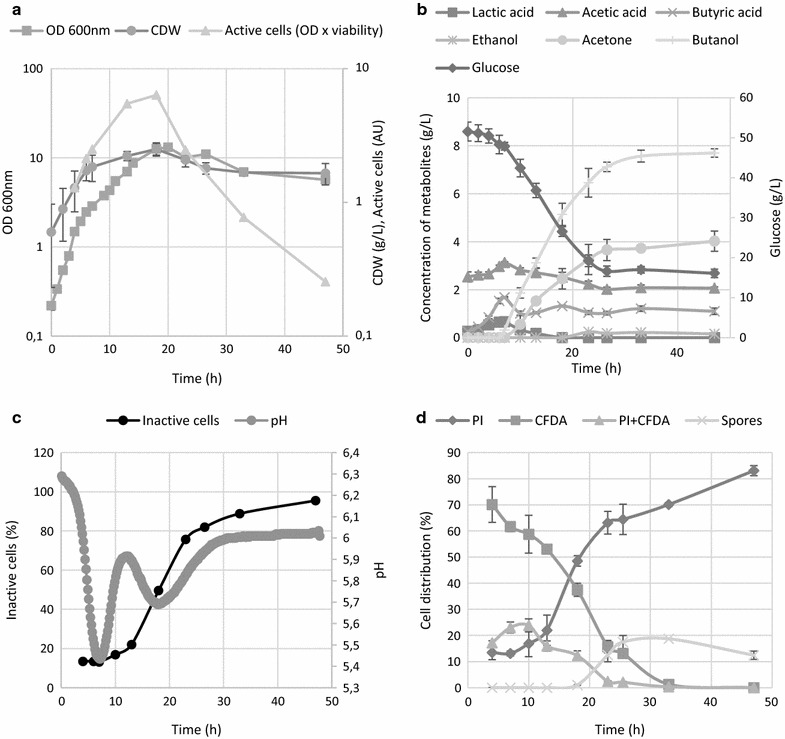
Fig. 1.

The time course of a cell growth and total amount of active cells (OD multiplied by reciprocal value of inactive cells from chart c), b metabolite formation, c pH and percentage of inactive cells, d distribution of different sub-populations according to their LS and fluorescence staining pattern for sporulation phenotype and ABE fermentation carried out on TYA medium without addition of external stress factors. Error bars represent standard deviations of three independent biological replicates, and calculated values are presented without error bars
