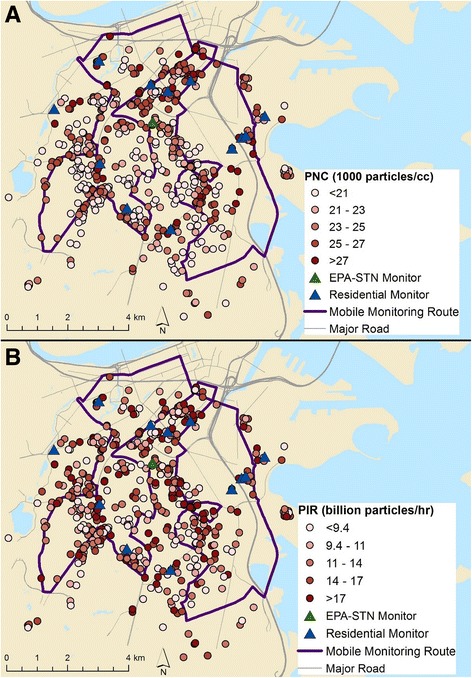
Fig. 1.

Spatial distribution of modeled annual average PNC and PIR. a) particle number concentration (PNC) and b) particle inhalation rate (PIR; by quintiles) at participant residences at baseline (n = 754). Data from mobile monitoring, a central monitor at a U.S. Environmental Protection Agency Speciation Trends Network (EPA-STN) site, and residential monitors were used to build and validate the PNC model
