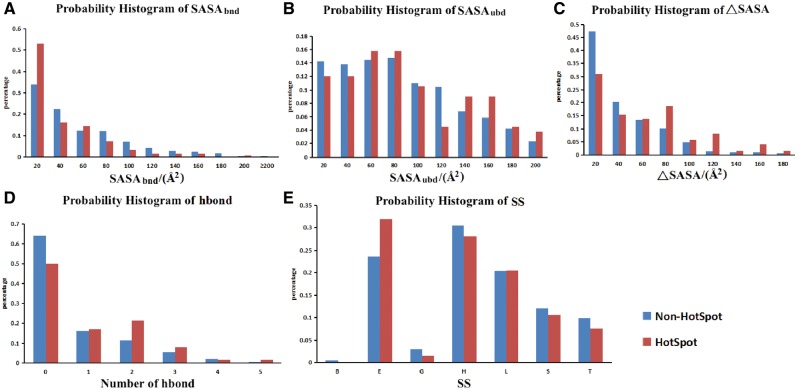
Figure 3.
The probability histograms of five features of hotspots and non-hot spots. (A) SASA of residues in bound state; (B) SASA of residues in unbound state; (C) buried SASA (ΔASA); (D) hydrogen bond number between proteins and nucleic acids; (E) secondary structure (SS). Hot spot was defined with a ΔΔG ≥2.0 kcal/mol.

