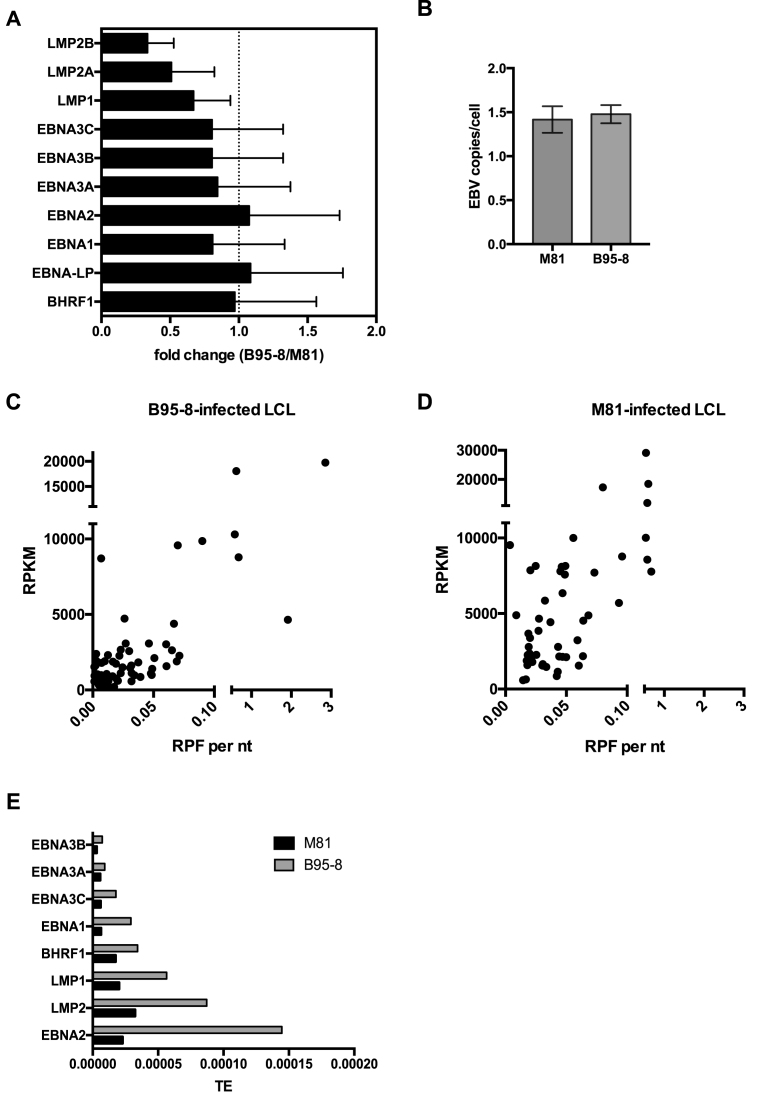
Figure 4.
Viral gene transcription and efficiency of translation in infected B cells. (A) The graph of bars shows a comparative analysis of latent gene transcription in cells infected with either M81 or B95–8. It gives the mean relative fold change of latent gene expression levels with standard deviation in B95–8-infected LCLs relative to M81-infected LCLs. (B) Genomic DNA was extracted from four independently established LCLs at 10 days post infection and the EBV copy number per cell was determined by qPCR. (C) and (D) The dot plots show the efficiency of translation in cells infected with B95–8 (C) or M81 (D). Each dot corresponds to one viral gene, whose y coordinate gives the transcription rate as reads per kilobase per million mapped reads (RPKM) and the x coordinate the number of RNAse-resistant ribosome protected footprint (RPF) reads per nucleotide (nt). (E) The graph shows a comparative analysis of the latent gene translation efficiency (TE) in cells infected with B95–8 or M81, displayed as the ratio between translation given as RPF and total transcription given as RPKM. Please also see Supplementary Figures S4, S7 and S8.

