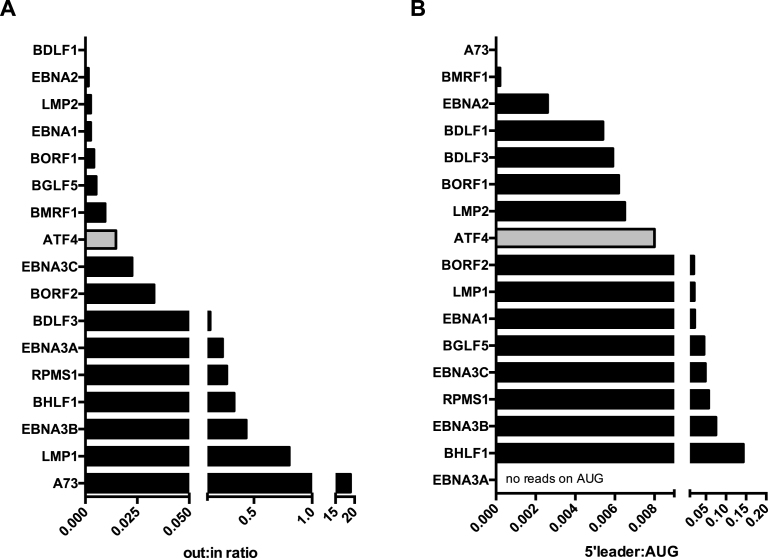
Figure 6.
Ribosome recruitment to the leader regions in EBV genes. (A) The graph shows the out:in ratios of selected EBV and cellular transcripts in cells infected with M81 and treated with cycloheximide. These ratios are obtained by dividing the number of RNAse-resistant ribosome protected footprints (RPF) that mapped to the 5′ leader region (out) by the number of reads that mapped to the open reading frame of the same gene (in). (B) The figure depicts the ratios between reads that mapped to the 5′ leader and those that mapped to the translation initiation codon of the same gene, or 5′ leader:AUG ratios in cells treated with harringtonine. More examples are given in Supplementary Figures S10–S14.

