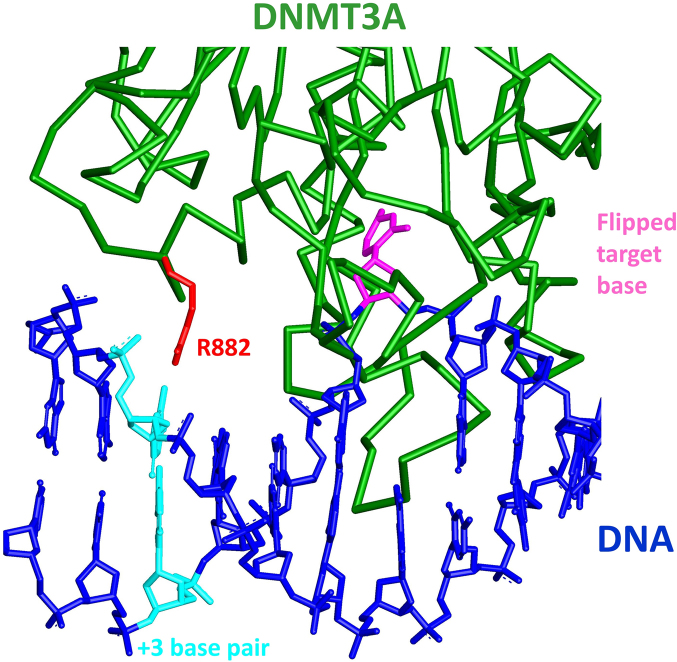
Figure 5.
Details of a model of the DNMT3A-DNA complex structure. The Cα-backbone of DNMT3A (pdb: 2QRV) is shown in green, R882 is in red. DNA (shown in blue) was modelled into the DNMT3A structure using the DNA molecule from the M.HhaI-DNA complex structure (pdb: 1MHT) by superposition of the conserved catalytic methyltransferase residues of M.HhaI and DNMT3A. The flipped target cytosine is shown in pink and the +3 base pair in cyan.

