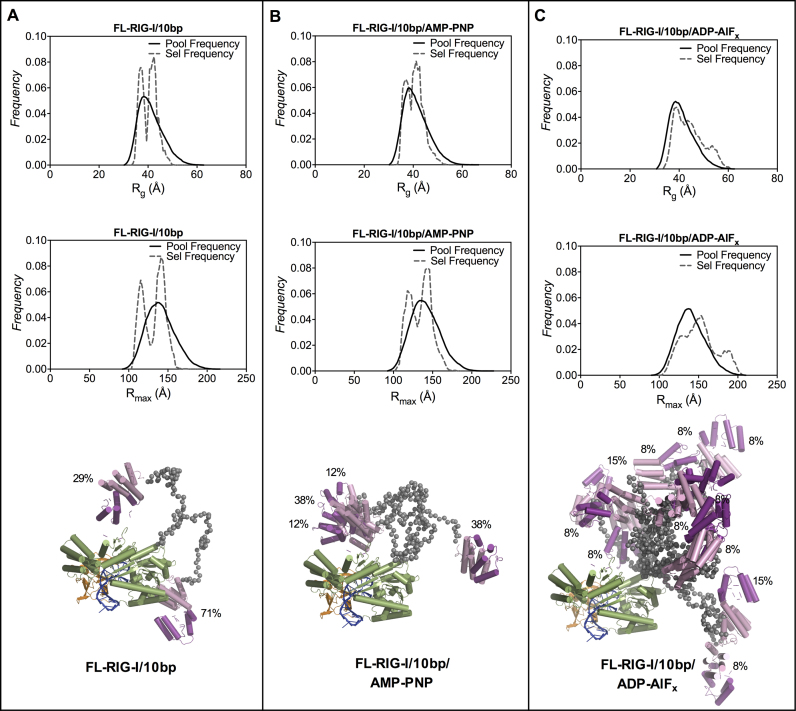
Figure 6.
Ensemble optimization method of analysis of SAXS data for FL-RIG-I/10 bp ± ATP analogues. Shown are the Rg and Rmax distribution of best fitting ensembles (dashed line) of EOM (57) selected structures of FL-RIG-I complexed with 10 bp in the absence of any ATP-analogue (A) or the presence of AMP-PNP (B) or ADP-AlFx (C) from a pool of 10000 conformers (solid line). The EOM selected best representative structures of FL-RIG-I/10 bp ± ATP analogues that, together, best predict the scattering data, are shown superposed (with their proportion contribution indicated as percentages). The coloring scheme is as used in previous figures, with the addition of blue used to depict the dsRNA. Fits are shown in Supplementary Information Figure S4.

