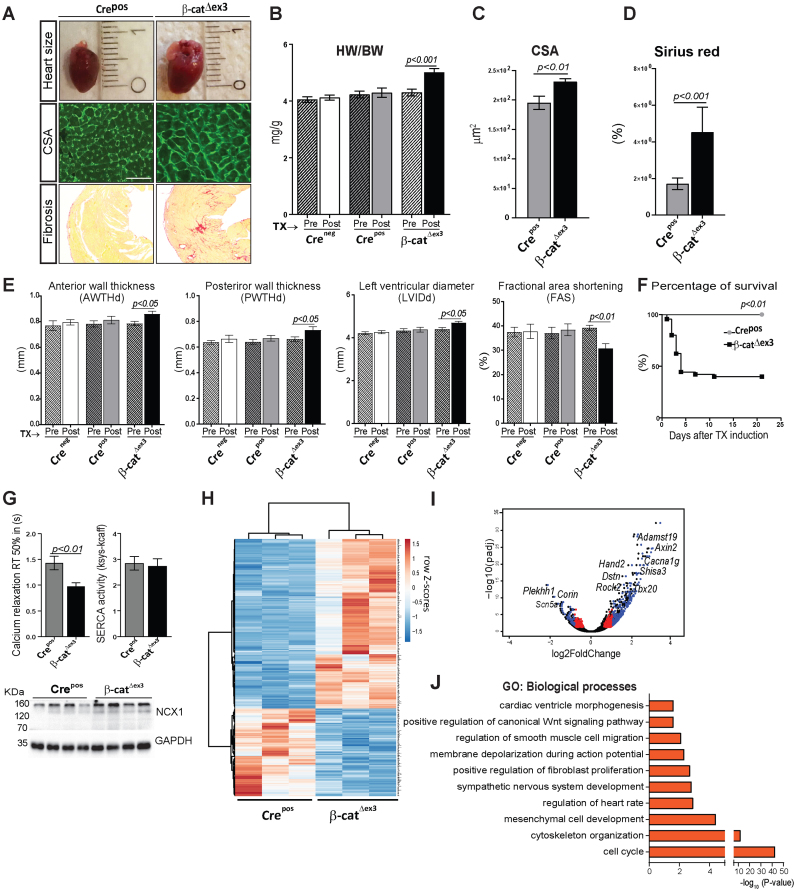
Figure 2.
Wnt activation promotes heart failure by triggering developmental reprogramming in the adult heart. Representative images (A) and quantification showing increased- (B) heart-to-body weight ratios (HW/BW, n ≥ 15/group), (C) CM cross-sectional area by WGA-FITC staining (n = 3; 150 cells/mouse) and (D) fibrosis by Sirius Red staining (n = 3/group) in β-catΔex3 versus control Crepos. (E) Echocardiographic analyses showing anterior and poster wall thickness diameters (AWTHd, PWTHd), left ventricular inner diameter (LVId) and fractional area shortening (FAS), 3 weeks post-TX induction in β-catΔex3 mice compared to Crepos and Creneg/β-catwt (Creneg) controls (n≥15/group). (F) Kaplan–Meier survival curve post-TX induction, n ≥ 21. (G) Half-times of intracellular calcium relaxation (RT50%) of caffeine induced-Ca2+-transients along with SERCA2 activity in β-catΔex3 and Crepos CMs (n = 6/4–21 cells per mouse). Ventricular protein expression of Na+–Ca2+ exchanger (NCX) in β-catΔex3 and Crepos hearts, n = 4. GAPDH serves as loading control in G. (H) Heatmap representing row Z-scores of RPKM values of all 572 differentially expressed genes (DEGs) with a cut-off: log2FC ± 0.5, P < 0.05 in Crepos and β-catΔex3 cardiac ventricles. Upregulated genes and downregulated genes are depicted in red and blue respectively (n = 3/group). (I) Volcano plot depicting the DEGs. Blue: DEGs with log2FC≥0.9 and p≤0.05; red: log2FC≤0.9 and P ≤ 0.05; black: unregulated genes. (J) Gene Ontology (GO) biological processes of upregulated (P≤ 0.05) genes. Data are mean ± SEM; t-test and ANOVA, Bonferroni's multiple comparison test. Scale bar in A: 20 μm.

