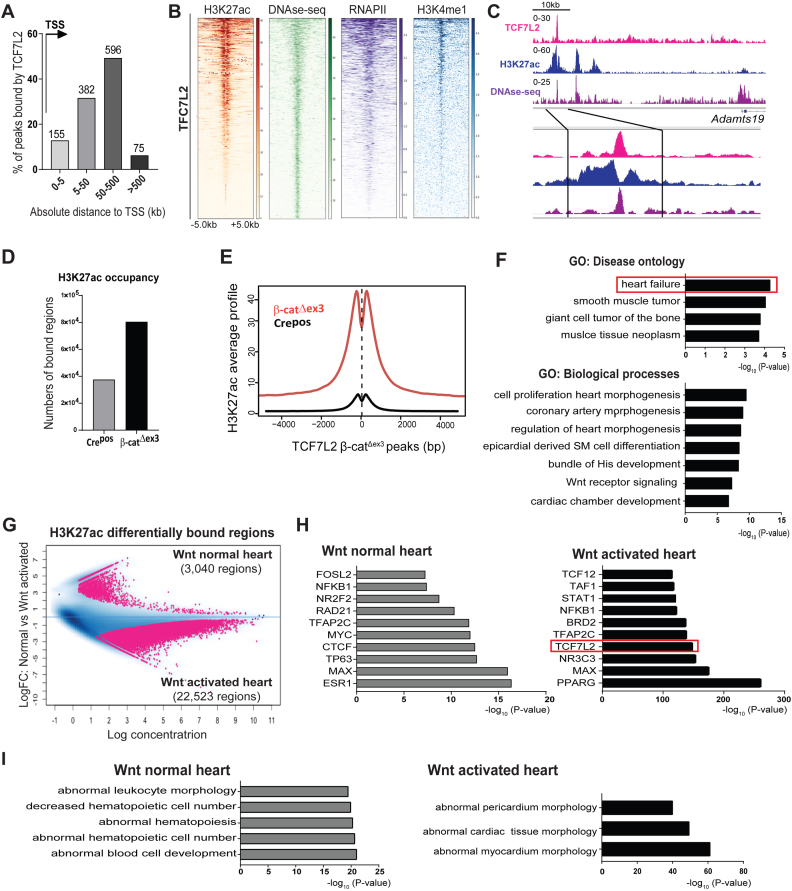
Figure 4.
Induced TCF7L2 and H3K27ac recruitment to disease-associated enhancers defines the β-catΔexon3 cardiac epigenome. (A) Genomic distribution of TCF7L2 occupancy in β-catΔex3 ventricles in number of regions and as distance from TSS (arrow) in kb. (B) Heatmaps of H3K27ac in β-catΔex3 ventricles and high sensitivity DNAse-sequencing (DHS), -RNAPII, -H3K4me1 occupancy in normal adult heart, on TCF7L2 occupied regions in β-catΔex3 ventricles, aligned according to their maximum signal of TCF7L2 occupancy. Scale depicts normalized RPKM values for heatmaps. (C) Exemplary occupancy profiles of TCF7L2, H3K27ac and DHS on an identified distal enhancer of Adamts19. (D) Total number of H3K27ac bound-regions as well as (E) average signal profiles of H3K27ac on TCF7L2 occupied loci in Crepos and β-catΔex3 ventricles. (F) GO disease ontologies of TCF7L2 bound regions in β-catΔex3 ventricles. (G) Binding affinity plot of 25,563 differential ChIPseq-H3K27ac enriched regions (pink dots) in the Wnt normal (3,040 regions, log FC > +0.5, n = 3) and in β-catΔex3 (Wnt activated) (22,523 regions, log FC < –0.5, n = 2) hearts. (H) Motif analysis on differentially enriched distal H3K27ac regions (5,748 from 22,523) in ‘Wnt activated’ and control ‘Wnt normal’. TCF7L2 motif occurrence is highlighted in an orange box. (I) Disease Ontologies are for the regions in H. For heatmaps regions ± 5 kb are shown.

