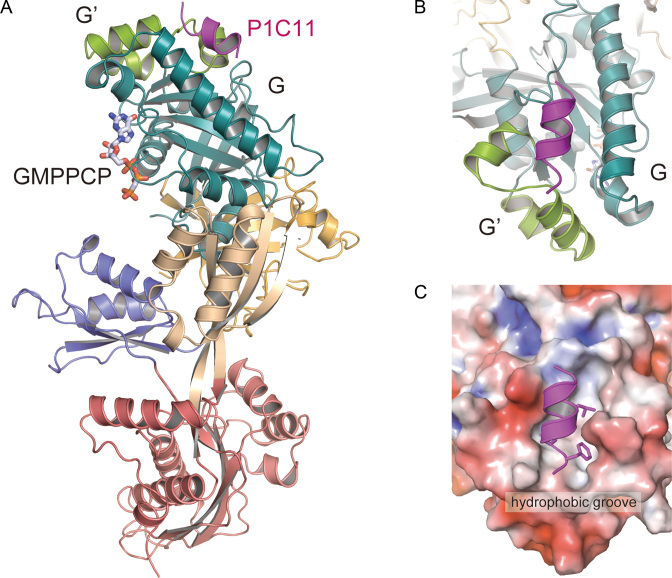
Figure 3.
Structure of PhoEF-2-GMPPCP in complex with 11 C-terminal residues of P1 (PhoEF-2-GMPPCP-P1C11). (A) Overall structure of PhoEF-2-GMPPCP-P1C11. The PhoEF-2 and GMPPCP are shown same as in Figure 1A. P1C11 is represented by a ribbon model (magenta). (B) Diagram illustrating how P1C11 was bound to a groove between subdomain G′ and domain G. (C) The electrostatic molecular surface of P1-binding groove of PhoEF-2. Positive, negative, and neutral electrostatic surface potentials are shown in blue, red, and white, respectively. Residues, G102, L103, L106, and F107 of P1C11, which are critical for binding PhoEF-2 (23), are represented by stick models.

