Figure 1.
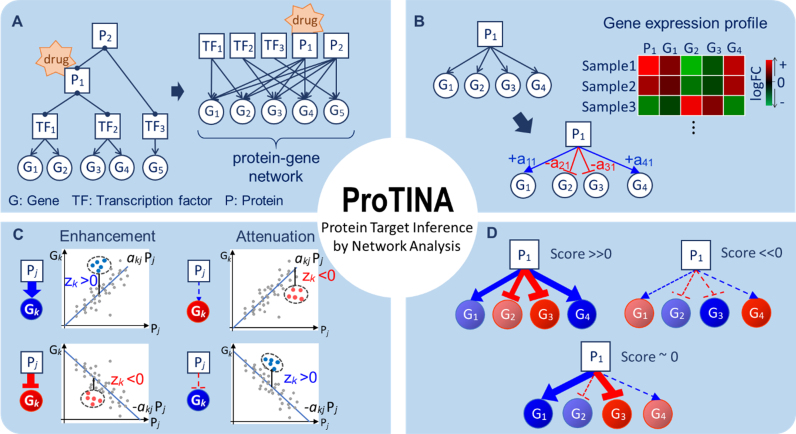
Protein target prediction by ProTINA. (A) The protein–gene network describes direct and indirect regulations of gene expression by transcription factors (TF) and their protein partners (P), respectively. A drug interaction with a protein is expected to cause differential expression of the downstream genes in the PGN. (B) Based on a kinetic model of gene transcriptional process, ProTINA infers the weights of the protein–gene regulatory edges, denoted by akj, using gene expression data. The variable akj describes the regulation of protein j on gene k, where the magnitude and sign of akj indicate the strength and mode (+akj: activation, –akj: repression) of the regulatory interaction, respectively. (C) A candidate protein target is scored based on the deviations in the expression of downstream genes from the PGN model prediction (Pj: log2FC expression of protein j, Gk: log2FC expression of gene k). The colored dots in the plots illustrate the log2FC data of a particular drug treatment, while the lines show the predicted expression of gene k by the (linear) PGN model. The variable zk denotes the z-score of the deviation of the expression of gene k from the PGN model prediction. A drug-induced enhancement of protein–gene regulatory interactions is indicated by a positive (negative) zk in the expression of genes that are activated (repressed) by the protein (i.e. akjzk > 0). Vice versa, a drug-induced attenuation is indicated by a negative (positive) zk in the expression of genes that are activated (repressed) by the protein (i.e. akjzk < 0). (D) The score of a candidate protein target is determined by combining the z-scores of the set of regulatory edges associated with the protein in the PGN. A positive (negative) score indicates a drug-induced enhancement (attenuation). The larger the magnitude of the score, the more consistent is the drug induced perturbations (enhancement/attenuation) on the protein–gene regulatory edges.

