Figure 2.
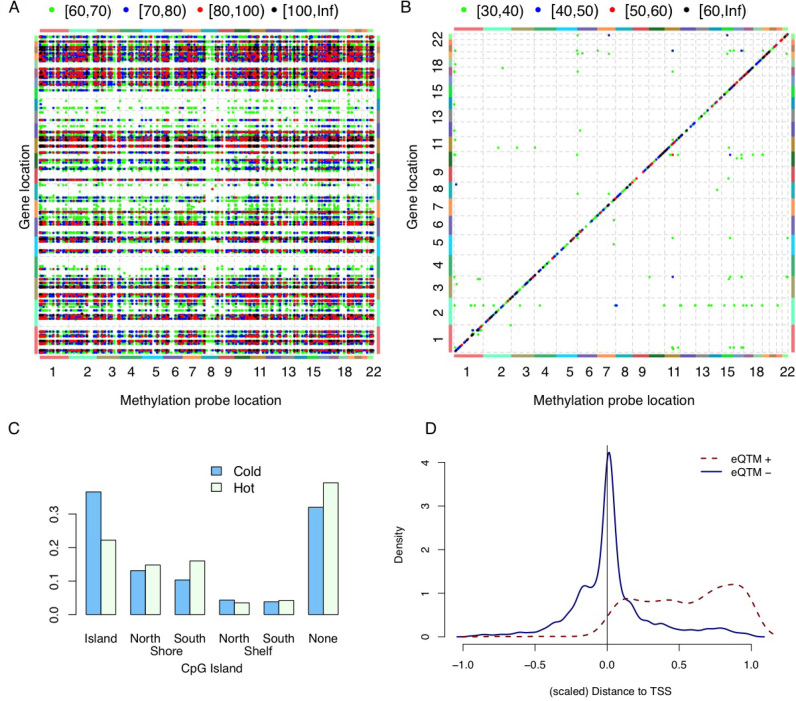
Associations between DNA methylation and gene expression. (A) Associations between DNA methylation and gene expression. Each point in this plot indicates the association between the DNA methylation of one probe (x-axis) and the expression of one gene (y-axis), after accounting for the effects of batches (sites and plates), age, three genotype PCs, SCNA of the corresponding gene and breast cancer subtypes. The color of each point indicates the range of the corresponding –log10(P-value), as shown in the legend at the top of the panel. (B) Association between DNA methylation and gene expression, after including all covariates used in (A) plus seven ME PCs. (C) The proportion of ‘hot’ (‘cold’) CpGs that are located at specific regions with respect to CpG Island. (D) The genomic location of gene expression quantitative trait methylation probes (eQTM) with respect to the location of its associated genes. [–1,0] is the region 1 kb upstream of transcription starting site (TSS), and [0,1] corresponds to gene body. All eQTMs are divided into two classes: those that are positively or negatively associated with gene expression, denoted by eQTM+ and eQTM–, respectively.

