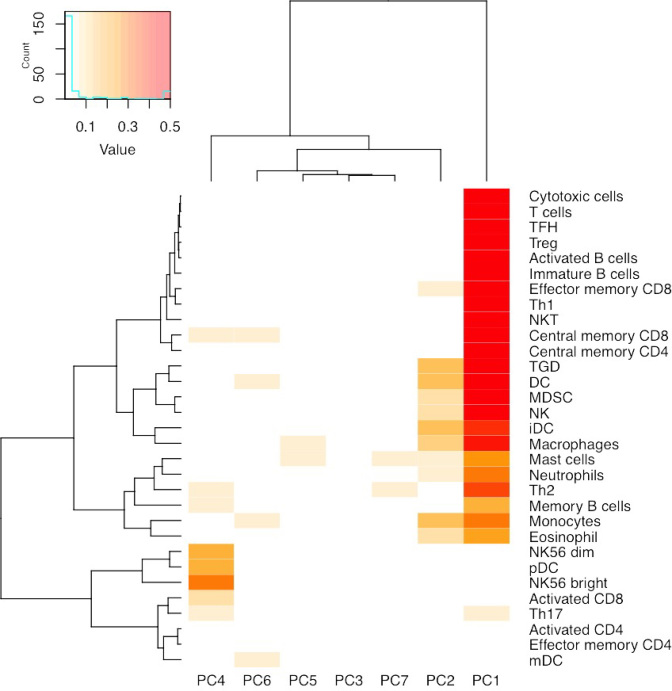
Figure 3.
Relations between cell type prevalence and ME PCs. The median expression of the genes annotated to each cell type was used as a surrogate for cell type prevalence, and it was regressed against top seven ME PCs. This Figure illustrates the proportion of variance explained by each of the top seven PCs. Values >0.5 are truncated for visualization contrast.

