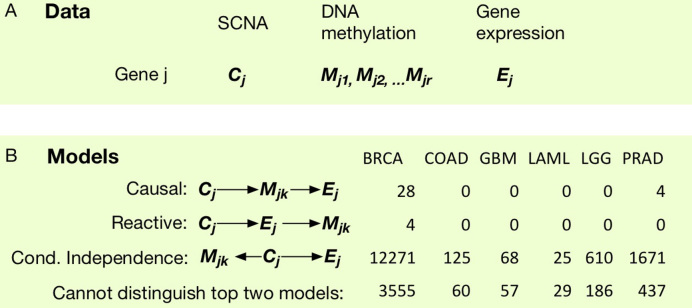
Figure 4.
Study the associations of SCNA (C), DNA methylation (M), and gene expression (E). (A) A gene-centric organization of the three types of data. Here, we focus on those cases with significant CM associations and the CpG is with 200 kb of the gene. (B) We compare the likelihood of three models and for each cancer type, and identify the number of CM pairs where one of the three models has significantly higher likelihood, or that the likelihoods of the top two models are not significantly different.

