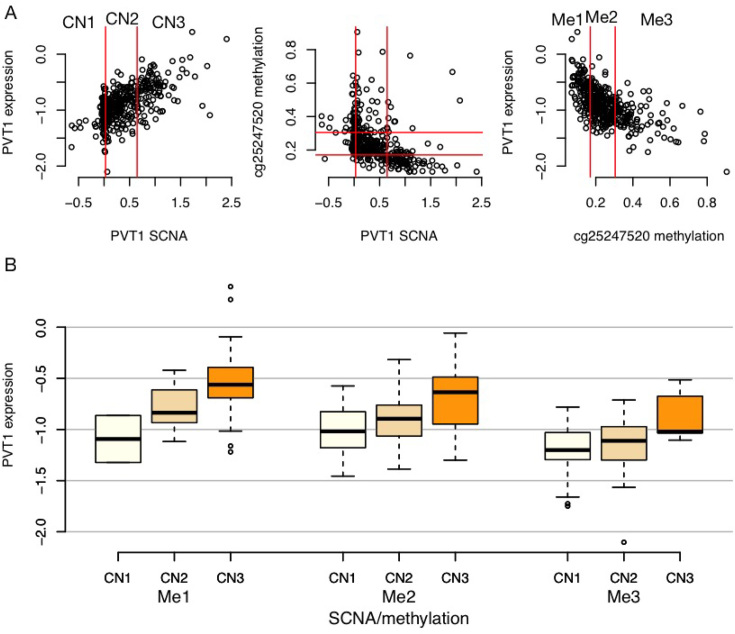
Figure 5.
An example where gene expression are associated with both SCNA and DNA methylation. (A) Scatter plots of SCNA of PVT1, the methylation of a CpG at its promoter, and its expression. The values of SCNA and methylation are partitioned into three categories based on 25th and 75th percentiles. (B) Distribution of gene expression with respect to SCNA and DNA methylation categories. Gene expression increases as SCNA increases and methylation decreases.

