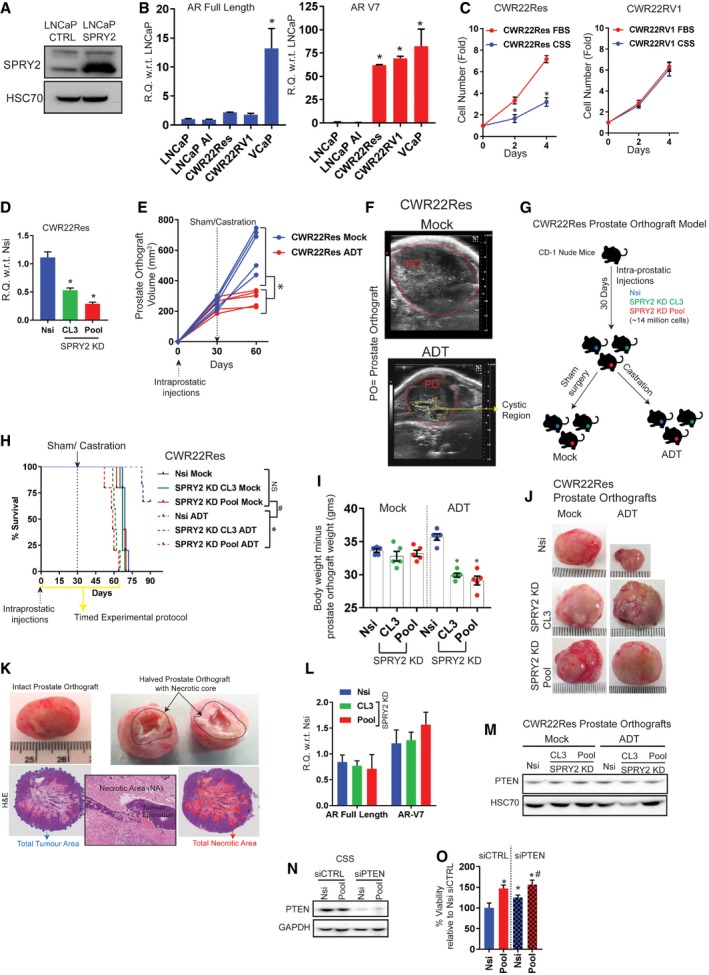
Representative immunoblot images for indicated proteins from cell lysates of control and SPRY2‐overexpressing LNCaP cells. HSC70 is used as loading control.
Relative levels of AR full‐length and AR‐V7 transcripts in indicated cell lines (n = 3; *P < 0.05 ANOVA Sidak's test).
Growth rate of CWR22Res and CWR22RV2 cells relative to Day 0 (T0) in hormone‐proficient (FBS) medium and hormone‐depleted (CSS) medium (n = 3; *P < 0.05; ANOVA Sidak's test).
The relative quantitation of SPRY2 mRNA in CWR22Res prostate cancer cells stably transfected with non‐silencing scrambled shRNA (Nsi) and shRNA targeting SPRY2 (CL3 and Pool SPRY2 knockdown clones) (n = 3; *P < 0.05 compared to Nsi; ANOVA Dunnett's test).
Ultrasound‐based CWR22Res prostate orthograft tumour volume measurements. Each animal is represented by single line and each observation by a data point (n = 5 mice per group; *P < 0.05 at 60 days’ time point; ANOVA Sidak's test).
Representative ultrasound images of mock‐ and ADT‐treated CWR22Res prostate orthografts (POs) at 60 days’ time point (E). The dotted red lines highlight the POs. The cystic region observed in the ultrasound in ADT‐treated orthograft may represent necrotic central core of the orthografts as shown in (K).
Approximately 14 × 106 of CWR22Res‐derived cells (Nsi and SPRY2 KD clones—CL3 and Pool, respectively) were injected in one of the anterior prostate lobes in CD‐1 nude mice. At day 30 post‐intra‐prostatic injections, mice were randomised for further treatments with either sham surgical incision (mock) or androgen deprivation therapy (ADT) by bilateral orchiectomy based on the abdominal palpation for the tumour burden.
Kaplan–Meier plot for overall survival of CD‐1 mice after intra‐prostatic injection of CWR22Res prostate cancer cells (Nsi control or CL3/Pool SPRY2 KD clones). The mice were randomised and treated with sham surgery or ADT (by castration) at 30 days post‐injections when the prostate orthografts were palpable. The clinical end point as per project licence was used as the measure for survival of the tumour‐bearing mice. Yellow line indicates refined 60 days protocol defined from this experiment (n = 5 mice per group; *P < 0.05 between ADT‐treated mice; #
P < 0.05 respective orthograft‐bearing mock‐ versus ADT‐treated mice; log‐rank Mantel–Cox test).
Analysis of body weights without the weights of the respective orthografts following ADT and mock treatments (n = 5 mice per group; *P < 0.05 ANOVA Tukey's test).
Representative images of indicated CWR22Res orthografts from mock and ADT‐treated mice (n = 5 mice per group).
Representative images of prostate orthograft (intact and halved). The black dotted area in the halved prostate orthograft marks the necrotic core. Representative H&E images of a prostate orthograft depicting the use of image analyser for calculating the percentage of the necrotic area (red area) normalised to total tumour area (blue dotted area). Insert image shows necrotic area (NA) surrounding the tumour epithelium (TE). Scale bar = 10 μm.
Relative levels of AR full‐length and AR‐V7 transcripts in Nsi control and CL3/Pool SPRY2 KD CWR22Res cell lines (n = 3).
Representative immunoblot images for indicated proteins from cell lysates of CWR22Res orthografts. HSC70 is used as loading control.
Representative immunoblot images for indicated proteins from cell lysates of CWR22Res‐derived cells with different SPRY2 and PTEN expression. GAPDH is used as loading control.
Relative survival measured by WST‐1 assay in CWR22Res cells with transient knockdown of PTEN grown in CSS‐containing medium (n = 3; *P < 0.05 compared to Nsi siCTRL; #
P < 0.05 compared to Nsi siPTEN; ANOVA Tukey's test).
Data Information: In (E, I), each data point represents one independent observation. In (C), each data point is mean of three independent observations. In (B–D, I, L, O), the data are presented as mean ± SD.

