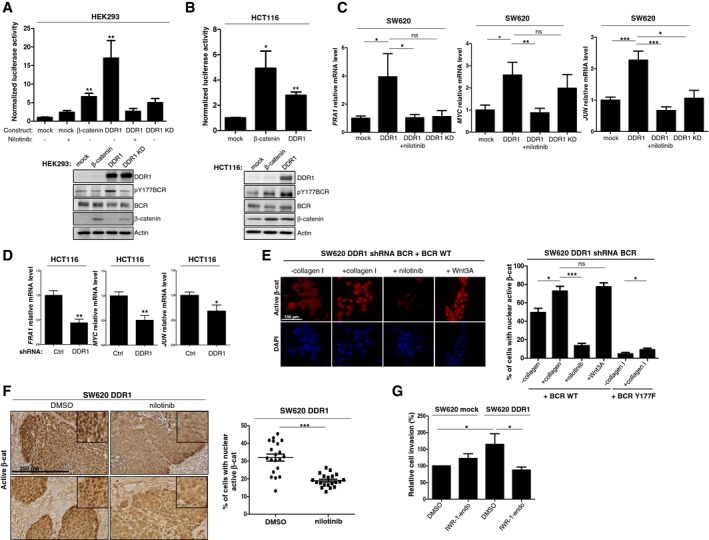
Figure 6. DDR1 kinase signalling increases β‐catenin transcriptional activity.

-
A, BDDR1 kinase activity increases β‐catenin transcriptional activity. (A) HEK293 cells and (B) HCT116 cells were transfected with TOPflash, mutant control FOPflash, Renilla luciferase and the indicated constructs and incubated (+) or not (−) with 100 nM nilotinib. The luciferase activity normalized to control condition is shown (mean ± SEM; n = 2 independent experiments with three replicates; *P < 0.05; **P < 0.01 Mann–Whitney test). Western blot analyses confirmed the expression of the different DDR1 variants and of β‐catenin.
-
CDDR1 kinase activity increases the transcript level of selected β‐catenin target genes in CRC cells. Relative transcript level of the indicated genes in SW620 cells infected with viruses that express the indicated DDR1 variants and incubated or not with 100 nM nilotinib as shown (mean ± SEM; n = 2 independent experiments with three replicates; ns: not significant; *p < 0.05 **P < 0.01; ***P < 0.001 Mann–Whitney test).
-
DDDR1 regulates the transcript level of selected β‐catenin target genes in CRC cells. Relative transcript level of the indicated genes in HCT116 cells infected with viruses that express that indicated shRNAs (mean ± SEM; n = 2 independent experiments with three replicates; ns: not significant; *P < 0.05; **P < 0.01; Mann–Whitney test).
-
EDDR1 signalling increases β‐catenin nuclear activity in CRC cells. Immunofluorescence analysis of active β‐catenin in SW620 cells infected with indicated viruses and stimulated overnight or not with collagen I (50 μg/ml), Wnt3A (200 ng/ml) and treated or not with nilotinib (100 nM) as indicated. A representative example (left panel) and quantification (right) of cells with active nuclear β‐catenin (mean ± SEM; n = 3; ns: not significant; *P < 0.05 ***P < 0.01; Mann–Whitney test). Scale bar: 100 μm.
-
FDDR1 signalling increases β‐catenin nuclear activity in metastatic CRC. IHC analysis of active β‐catenin level in experimental metastatic tumours described in Fig 3F. A representative example (left) and quantification (right) of CRC cells with active nuclear β‐catenin (mean ± SEM; n = 5 tumours per group with 4 fields per tumour; ns: not significant; *P < 0.05 ***P < 0.001; Mann–Whitney test). Scale bar: 250 μm.
-
GDDR1 invasive activity in CRC cells requires proper β‐catenin expression. Invasion assays in Boyden chambers of SW620 cells infected with the indicated viruses and incubated with DMSO or with 0.1 mM of the β‐catenin pharmacological inhibitor IWR‐1‐endo (mean ± SEM; n = 3; *P < 0.05 Student's t‐test).
Source data are available online for this figure.
