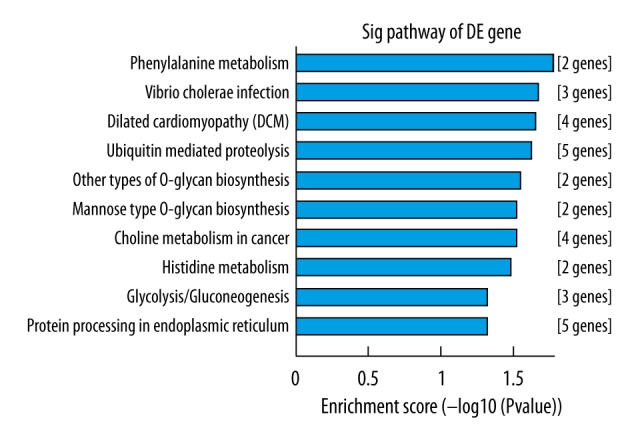
Figure 10.

KEGG (Kyoto Encyclopedia of Genes and Genomes) enrichment analysis of the predicted targets of the differentially expressed miRNAs. The vertical axis is the enriched pathway category, and the horizontal axis is the –log10 P value of the enrichment of pathways.
