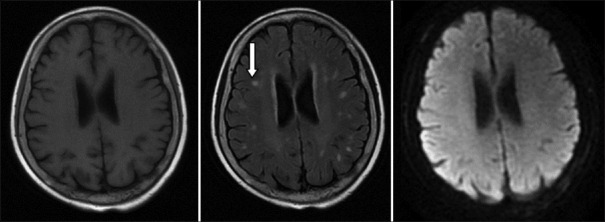
Figure 1.
In both sides of the bilateral ventricle and in the deep white area of the brain, spotted abnormal signal is shown on T1-weighted image or lower signal, with high signal on T2-weighted image and fluid-attenuated inversion recovery (white arrow), and the boundary is clear. No abnormal high signal is seen on diffusion-weighted image.

