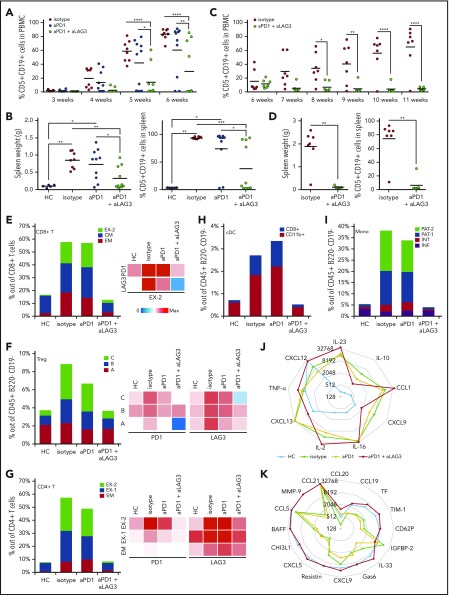
Figure 2.
Dual PD1 and LAG3 blockade limits CLL development and restores immune cell populations. (A-D) The tumor load of individual mice is depicted by the percentage of CD5+CD19+ cells in the peripheral blood (A,C) and spleen (B,D; weight in grams [left] and percentage of CD5+CD19+ [right]) in 2 independent cohorts (cohort 1, A-B and cohort 2, C-D). For all panels, *P < .05, **P < .01, ***P < .001, ****P < .0001. (E-I) Bar charts representing the percentage of cells present in healthy controls C57BL/6 (HC, n = 3) and AT-TCL1 mice following therapy (isotype, aPD1, or aPD1 + aLAG3, n = 3 from cohort 1). Selected clusters showing a significant enrichment are depicted for CD8+ T cells (E), Treg cells (F), CD4+ T cells (G), cDCs (H), and monocytes (I) in AT-TCL1 compared with C57BL/6 mice and a decrease upon dual aPD1 + aLAG3 therapy. Heatmaps represent the median signal intensity of PD1 and LAG3 in selected subsets of immune cells. CM central memory; EM effector memory; EX exhausted; INF, inflammatory; INT, intermediate. (J-K) Levels of selected cytokines and soluble factors in blood serum (J) and spleen plasma (K) from C57BL/6 (HC, n = 3) and AT-TCL1 mice following therapy (isotype, aPD1, or aPD1 + aLAG3, n = 3 from cohort 1, same animals as E-I), quantified using mouse cytokine arrays.

