Figure 1.
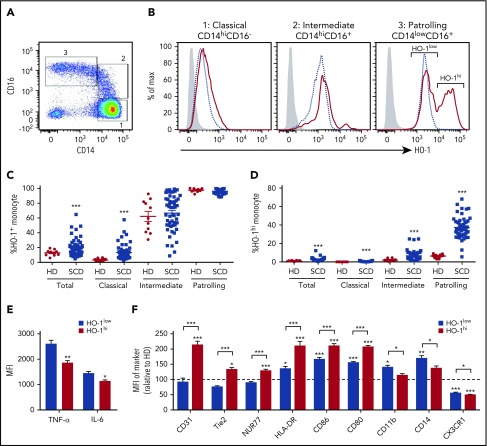
HO-1hiPMo characterization. (A) Representative dot plot of CD14 and CD16 expression in circulating monocytes of SCD patients showing 3 subsets: classical CD14hiCD16− (gate 1), intermediate CD14hiCD16+ (gate 2), and patrolling CD14lowCD16+ (PMo) (gate 3). (B) Representative histograms comparing HO-1 expression in the 3 monocyte subsets from SCD patients (red solid line) and race-matched healthy controls (blue dashed line). Isotype control is shown as gray-filled histogram. Gating for HO-1+ population was set according to the corresponding isotype background. Two peaks of HO-1 expression, indicated as HO-1hi and HO-1low, can be clearly discerned in PMos from SCD patients. (C) Frequencies of total HO-1+–expressing circulating monocyte populations (relative to isotype control) in race-matched healthy controls (n = 10) and SCD patients (n = 52). (D) Frequencies of HO-1hi–expressing monocytes (based on the gating strategy in PMos as shown in panel B) in the same individuals as in panel C: 10 race-matched healthy controls and 52 SCD patients. (E) PMos from SCD patients (n = 8) were purified, and following 4 hours LPS (200 ng/mL) stimulation, intracellular TNF-α and IL-6 expression in HO-1hi vs HO-1low subpopulations of PMos was measured by flow cytometry. (F) Expression of monocyte markers in HO-1hi and HO-1low PMos from SCD patients (n = 21) relative to levels expression by HD HO-1low PMo. Data represent mean ± SEM; means in panels C and D were compared using 2-tailed Student t test. Means in panels E and F were compared using 2-tailed paired Student t test. *P < .05; **P < .01; ***P < .001. MFI, mean fluorescence intensity.

