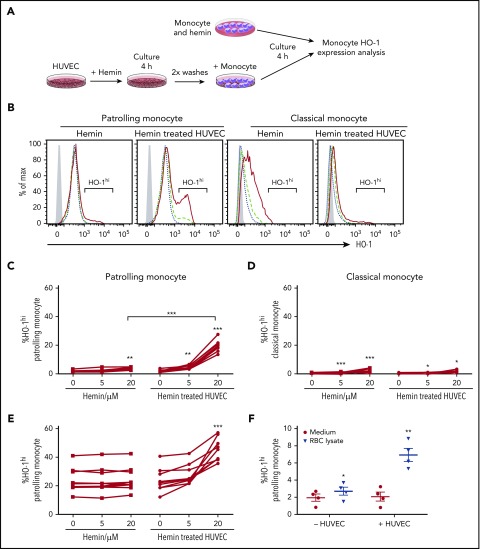
Figure 2.
Hemin-treated HUVECs induce high-level HO-1 expression in PMo. (A) Schematic representation of experimental design. Purified total monocytes were cultured directly with hemin or with HUVECs pretreated with hemin for 4 hours before monocyte HO-1 expression analysis. (B) Representative histograms comparing HO-1 expression in monocyte subsets from the cultures without or with HUVECs. No hemin (blue short dashed line), hemin 5 µM (green long dashed line), and hemin 20 µM (red solid line). Isotype control is shown as gray-filled histogram. Frequencies of HO-1hi–expressing (C) PMos and (D) CMos from HDs (n = 7) following 4 hours of exposure of purified monocytes to heme alone (5 and 20 µM) or HUVECs pretreated with hemin (5 and 20 µM). (E) Frequencies of HO-1hi–expressing PMos from SCD patients (n = 9) using the same experimental protocol as for HDs. (F) Frequencies of HO-1hi–expressing PMos from HDs (n = 4) exposed to RBC lysate (120 µM total heme level) alone or HUVECs pretreated with RBC lysate. Data represent mean ± SEM; means were compared using 2-tailed paired Student t test. *P < .05; **P < .01; ***P < .001.

