Figure 3.
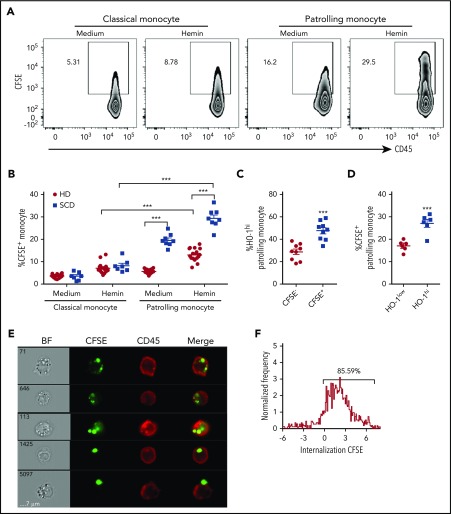
PMos uptake hemin-exposed HUVECs. CFSE-labeled HUVECs were pretreated without (“medium”) or with hemin (20 µM) before coculturing with purified monocytes from HDs (n = 18, filled circles) or SCD patients (n = 8, filled squares) for 4 hours. (A) Representative dot plots comparing CFSE+ classical and PMos. (B) Frequencies of CFSE+ classical and PMos are shown. (C) Frequencies of HO-1hi–expressing cells in PMos from HDs (n = 9) comparing CFSE− (no attachment/uptake of CFSE+ cellular material) and CFSE+ (representing cells that have adhered to/taken up CFSE+ cellular material) subpopulations following coculture with labeled hemin-treated HUVECs. (D) Comparison of frequencies of CFSE+ PMos from SCD patients (n = 6) in HO-1low vs HO-1hi subpopulations following coculture with HUVECs. (E) Representative flow cytometry images acquired simultaneously and gated on CFSE+ patrolling CD14lowCD16+ monocytes from SCD patients (from panel A). Right to left: single-channel bright field (BF), CFSE (representing HUVEC material in green), CD45 (representing PMos in red), and merged images showing CFSE+ materials within CD45+ cells in the first 4 rows, but not in the last row where CFSE+ material is attached to the external surface of PMo. (F) Histogram depicting degree of CFSE+ material internalized within PMos with internalization score: <0 represents CFSE+ material attached to the surface of PMos; >0 represents CFSE+ material internalized by PMo. Percentage of cells with internalization score of >0 is indicated. Data represent mean ± SEM; means were compared using 2-tailed paired Student t test (medium vs hemin treatment as well as monocyte subset vs other monocyte subset in the same donor/patient) and unpaired Student t tests (HD vs SCD patients). ***P < .001.

