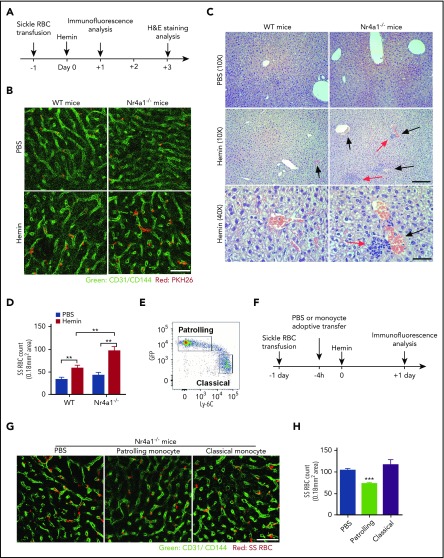
Figure 7.
Increased sickle RBC stasis in Nr4a1−/−mice and reversal by adoptively transferred PMo. (A) Experimental schedule for induction of sickle RBC stasis and analysis. WT mice and Nr4a1−/− mice were transfused with PKH26-labeled mouse sickle RBCs (1.5 × 10⁹ RBCs per mouse) followed by injection of hemin (30 μmol/kg mouse) followed by analysis at the indicated times. As a control, some of the transfused mice received PBS instead of hemin. (B) Whole mount immunofluorescence of perfused livers from WT or Nr4a1−/− mice showing CD31/CD144 (endothelial markers, green) and PKH26 (red). Scale bar = 50 µm. (C) Representative hematoxylin and eosin (H&E)–stained liver sections of sickle RBC transfused mice (scale bars = 200 µm [first 2 rows] and 50 µm [last row]). Black arrows indicate RBC stasis within blood vessels. Red arrows depict leukocyte infiltration. (D) Enumeration of PKH26+, representing sickle RBCs (“SS RBC”), per image in perfused livers in panel B as quantified using Image J software, indicating increased stasis in hemin-treated Nr4a1−/− mice. (E) Gating strategy for sorting GFP+ Ly6C− PMos and GFPlowLy-C6+ CMo populations from spleen and blood of Nr4a1-GFP reporter mice. (F) Experimental schedule for adoptive transfer of sorted monocyte subsets into sickle RBC stasis model and analysis. PBS or purified PMos or CMos were adoptively transferred (5 × 10⁵ monocytes per mouse) into Nr4a1−/− mice that had received first PKH26-labeled sickle RBCs (1.5 × 10⁹ RBCs per mouse) followed by injection of hemin (30 μmol/kg mouse) and analysis at the indicated times. (G) Representative confocal images in liver blocks of perfused mice comparing control PBS mice (no adoptive transfer) and PMos or CMos adoptively transferred mice. Scale bar = 50 μm. (H) Enumeration of sickle RBCs per image in perfused livers as quantified using Image J software. Data represent mean ± SEM; means were compared using 2-tailed Student t test. **P < .01; ***P < .001 (n = 6-8 mice per group).

