

 Selective oxidation of V is observed when coordinated with a redox-active ligand, forming a single V
O product.
Selective oxidation of V is observed when coordinated with a redox-active ligand, forming a single V
O product.
Abstract
Metal–organic coordination networks at surfaces, formed by on-surface redox assembly, are of interest for designing specific and selective chemical function at surfaces for heterogeneous catalysts and other applications. The chemical reactivity of single-site transition metals in on-surface coordination networks, which is essential to these applications, has not previously been fully characterized. Here, we demonstrate with a surface-supported, single-site V system that not only are these sites active toward dioxygen activation, but the products of that reaction show much higher selectivity than traditional vanadium nanoparticles, leading to only one V-oxo product. We have studied the chemical reactivity of one-dimensional metal–organic vanadium – 3,6-di(2-pyridyl)-1,2,4,5-tetrazine (DPTZ) chains with O2. The electron-rich chains self-assemble through an on-surface redox process on the Au(100) surface and are characterized by X-ray photoelectron spectroscopy, scanning tunneling microscopy, high-resolution electron energy loss spectroscopy, and density functional theory. Reaction of V-DPTZ chains with O2 causes an increase in V oxidation state from VII to VIV, resulting in a single strongly bonded (DPTZ2–)VIVO product and spillover of O to the Au surface. DFT calculations confirm these products and also suggest new candidate intermediate states, providing mechanistic insight into this on-surface reaction. In contrast, the oxidation of ligand-free V is less complete and results in multiple oxygen-bound products. This demonstrates the high chemical selectivity of single-site metal centers in metal–ligand complexes at surfaces compared to metal nanoislands.
Introduction
Single-site catalysts have long been sought after as the next step in heterogeneous catalyst development.1 A variety of strategies have been used to create single-site reaction centers, including reaction sites formed in metal–organic frameworks2–5 and single-site alloy systems on metals and oxides.6–10 There has also been extensive work, including reactivity studies, on tethered metal complexes on metal nanoparticles11 and oxides.12–18 In general, single-sites in these systems show higher selectivity than typical heterogeneous catalysts19 and the ability to avoid coking in a variety of chemical reactions.20 A newer method for forming single-sites is on-surface metal–ligand coordination to produce metal–organic networks on a solid surface. These have generated growing interest due to the uniformity of the single-site metal centers that they produce.21–25 The structure of on-surface metal–ligand networks is determined by the coordination of metal atoms to organic ligands, which form through self-assembly. This strategy for single-site formation has many advantages, such as the previously mentioned uniformity of the metal sites, which should allow for high selectivity, and their open axial coordination sites, which makes these metal centers good potential reaction sites, in addition to being well suited for gas sensor applications.26 Contact with the underlying surface is also an advantage, as the surface can play a beneficial role in reaction mechanisms, which allows for additional, more complicated, chemistry to occur. One specific example of an on-surface metal–ligand coordination network, which has been studied in detail both experimentally27,28 and theoretically,29 is the formation of 1D chains by on-surface redox-active self-assembly of platinum atoms and dipyridinyltetrazine (DPTZ). The Pt atoms in this structure have been oxidized to PtII and the DPTZ ligands have been reduced.
As often as the above advantages of on-surface metal–organic coordination networks have been discussed, they have rarely been demonstrated. In most previous studies investigating the interaction of gases with on-surface coordination networks, the gas molecules simply adsorb, with no further chemistry occurring until they later desorb intact. For example, nitric oxide (NO) was found to bind to Fe and Co metal centers (bound in porphyrins) where it was seen that the strength of the metal bonds to the Ag(111) surface were noticeably weakened after complexation with NO.30 The NO coordination was reversed between 500–600 K. A previous study also shows the physisorption of CO2 on 1D metal–ligand chains formed from Au adatoms and 1,4-phenylene diisocyanide ligands on Au(111) and Au(100),31 where a temperature of 90 K was needed for the CO2 to adsorb, indicating a weak gas interaction.
In some cases reactivity has been demonstrated, such as O2 cleavage by manganese porphyrins on the Ag(111) surface.32 The metal centers were oxidized from MnII to MnIII, with one oxygen atom bound to each Mn center but the mechanism for the migration of one oxygen atom to the neighboring unoxidized Mn center was not discussed. Oxygen was also shown to dissociate, and then recombine, on di-iron centers formed by coordination with terephthalic acid on the Cu(001) surface.33 Two O2 molecules react with the di-iron centers, leaving two bound oxygen atoms (one on each Fe) and a recombined O2 molecule, which leaves. Upon oxidation, the Fe–Fe bond distance in this study decreases from 4.45 Å to 3.82 Å. While these studies show the potential reactivity towards bond cleavage that single-site metals in on-surface coordination networks can have, they do not address the single-site selectivity advantage that should also be present.
The results presented in this paper are in one way distinguished from previous surface syntheses because of the choice of DPTZ as the coordinating ligand. Because it is redox-active, after metal coordination, the reducing power of the metal is retained nearby, stored in the π* orbitals of DPTZ, leaving them available for subsequent use towards the substrate, in this case O2. DPTZ also contains binding pockets that are well suited for metal coordination. The diverging nature of DPTZ nitrogen lone pairs, with these binding pockets located on either side of the molecule, allows for the formation of extended coordination chains.
Vanadium has been chosen for study here since it exists in a large number of adjacent oxidation states, with facile interconversion among these, and because of its wide use in metal–ligand complexes for homogeneous catalysis34,35 and its oxides in heterogeneous catalysis.36–39 Although vanadium oxide formation has been studied on a variety of surfaces,40–46 only rarely has the oxidation of individual metal particles been examined,47 which is central to the results we present here. O2 reacting with V metal centers in metal–ligand networks on surfaces has not been previously studied, but is important to consider, given the importance of vanadium and vanadium oxides in both oxidation reactions48,49 and oxygen reduction reactions.50 Vanadium phthalocyanine complexes have been synthesized on the Ag(111) surface,51 and vanadium oxide phthalocyanine complexes on surfaces have also been studied,52,53 but these complexes were deposited pre-made, not created via an on-surface reaction.
The V complex used in this paper is formed by an on-surface redox process between elemental vanadium and DPTZ (Scheme 1) on a Au(100) surface to form VII sites; this on-surface redox process was the subject of a recent publication.54 Here, we address the reactivity of these V single-site complexes with dioxygen. The combination of scanning tunneling microscopy (STM), X-ray photoelectron spectroscopy (XPS), and high-resolution electron energy loss spectroscopy (HREELS) allows clear characterization of the reaction product. The use of density functional theory (DFT) allows for detailed mechanistic and structural understanding of V-DPTZ and its interaction with the Au(100) surface through the reaction with O2.
Scheme 1. Di-pyridinyltetrazine (DPTZ) and the M–L Polymer that forms after their redox assembly on the Au(100) surface.

This vanadium oxidation reaction is of interest because it produces a variety of products on metallic V nanoislands.55,56 However, as we shall show, nearly all of the single site V atoms undergo a two electron oxidation to the same product. To our knowledge, this is the first time that such an oxophilic metal has been used in single-site metal–ligand assembly reactivity studies. Providing a direct comparison between metal/surface and metal–organic/surface behavior in the context of reactivity with a gaseous species has not previously been shown, and allows for a unique insight into the role that ligands play in the increased selectivity of coordinated metal centers compared to metal nanoislands.
Results and discussion
Vanadium nanoisland oxidation on Au(100)
The Au(100) surface, used for all of the experiments presented in this work, undergoes a spontaneous reconstruction of the top-most atomic layer to more closely resemble the packing of the lower-energy Au(111) hexagonal packed surface.57–59 One effect of this well-characterized reconstruction is a periodic variation in the heights of the Au atoms or “rows”, which lead to anisotropy in the growth of metal islands on this surface.58 Vanadium grows on Au(100) at submonolayer coverages as flat, rectangular nanoislands that are oriented in the direction of the row features created by the surface reconstruction (Fig. 1d), similar to the growth of other metals on the same surface.58 The average height of these islands is 2.3 ± 0.2 Å. XPS shows that the V in these islands is in a zero oxidation state (Fig. 1a). The V islands were exposed to a small amount of O2 gas by back-filling the chamber to 1 × 10⁻⁶ Torr O2 for 50 seconds, which is a 50 Langmuir (L) exposure (50 L means that, on average, each surface atom experiences 50 collisions from O2 gas molecules). After a 50 L O2 exposure while holding the surface at 190 °C, the originally flat rectangular V islands become rounded particles with an average height of 6.1 ± 1.5 Å, with only a small amount of flat islands remaining (Fig. 1e). Some rounded particles are observed on the few remaining flat V islands, usually at the edges of the islands (Fig. 1e), which may indicate a higher reactivity of the island edges compared to the centers. XPS data shows the appearance of an oxygen peak (Fig. 1b) and a number ratio of oxygen to V of 0.8 : 1. There is also a noticeable change in the V 2p peak width and position in XPS compared to before oxygen exposure (Fig. 1b). The full width at half maximum (FWHM) of both the V 2p3/2 and 2p1/2 peaks increase significantly, from 3.1 eV to 4.3 eV. The binding energy (BE) of the V 2p3/2 peak increases by 1.6 eV to 514.5 eV, indicating oxidation of the V. Based on the increased FWHM of the V 2p XPS peaks, we can conclude that not all of the V is oxidized. A fit model deconvoluting this data into V0 and VIII components is shown in Fig. S6.†
Fig. 1. XP spectra and STM images showing the reaction of O2 with V metal deposited on the Au(100) surface while holding the surface at 190 °C. (a, b, c) XPS data shown as black points with fit components in red and blue colors and the sum of the fit components as a black line. (a) XPS of metallic V with (d) corresponding STM image of V islands. (b) After 50 L O2 exposure, an O 1s component is clearly observed along with a shift in the V peak position with (e) corresponding STM image. (c) After 1500 L of O2, the surface has been saturated and (f) corresponding STM images showing the resulting VOx nanoparticles. After reaction with O2, the V 2p peaks are noticeably wider, indicating the presence of multiple V oxidation states. The vertical blue and red lines drawn through the XPS data show the positions of the V oxidation states of 0 and +3, respectively. Note that all of these XPS and STM measurements were made in the same UHV system on the same sample.

High-resolution electron energy loss spectroscopy (HREELS) is a surface-sensitive vibrational spectroscopy technique that allows for direct chemical characterization of reactions and bonding on a surface and is particularly effective for organic compounds.60,61 Details regarding the experimental procedure for HREELS can be found in the ESI.† When the V/Au(100) surface is exposed to 50 L of O2, a new HREELS peak is observed at 1029 cm–1 corresponding to a vanadyl terminal VO stretching mode, showing O/O bond scission, as well as a broad feature at 684 cm–1 due to the V–O–V bridging features that result from O binding to multiple V atoms in various conformations (Fig. 2).55,56,62,63 These indicate that there is not one uniform V oxide structure, but multiple binding sites for O on the V nanoparticles. As the O2 exposure is increased to 500 L, a new peak appears between the 684 and 1029 cm–1 peaks. We note that no significant spectral features are observed for V/Au before O2 exposure and that the clean Au(100) surface is completely inert to these O2 exposures as determined by HREELS.
Fig. 2. HREELS of V deposited onto Au(100) with increasing oxygen exposures. The V sample was initially annealed at 190 °C to remove weakly adsorbed contamination. Each O2 exposure was performed while the sample was held at 190 °C and HREELS was acquired after cooling to RT. The vanadyl peak (V O) is observed at 1029 cm–1. At lower energies there is a very broad feature correlating to V–O–V bending modes. The broad shape results from the several possible vanadium oxide structures that could form.

Longer O2 exposure experiments were conducted to test whether VOx could be driven to a more uniform oxidation state. Further O2 exposures at 190 °C reveal that the surface saturates at a total exposure of 1500 L (Fig. 1c); exposures beyond that did not result in any changes in the XP spectra. At this point, the V 2p3/2 peak shifted by an additional 0.8 eV to reach a position of 515.3 eV, indicating oxidation of more V, with an O : V number ratio of 1.2. The FWHM decreased slightly, to 3.9 eV, but remains much larger than V alone on the surface (3.1 eV), showing that although the V oxidation states are better defined than at lower exposures, V still exists in multiple oxidation states. STM reveals that the surface is populated by bright, round particles with an average height of 8.9 ± 1.6 Å (Fig. 1f). The increased height of these particles is due to both their increased oxygen content and sintering as a result of the 190 °C annealing done during the exposure steps; this reshaping is expected under these thermal conditions.64 To further confirm the effect of oxygen on the size of the particles, the average particle volume was calculated by tabulating many particles from several images. Although the average particle volume decreases after oxygen exposure, as the reaction with O2 breaks up the larger V islands into smaller particles (Fig. 1), the total volume per 80 nm × 80 nm STM image increases noticeably. Before O2 exposure, the V islands occupy an average volume of 89 nm3 per image. After 50 L of total exposure, this volume increased to 182 nm3 and it increased further to 237 nm3 after 1500 L of total exposure. This significant increase in the total mass of the adsorbed islands is due to the binding of O during oxidation. This value did not increase after further O2 exposure, providing additional evidence that the surface was already saturated.
To provide a comparison to these results, an additional experiment was performed where V was deposited onto the Au(100) surface in an oxygen background of 1.0 × 10⁻⁶ Torr. This procedure resulted in the formation of V2O3, as evidenced by the oxidation of all of the V to VIII (V 2p3/2 peak position of 515.2 eV), with an O : V ratio of 1.7 (Fig. S3†). After annealing the surface at 350 °C, V2O3 remains on the surface, with a V 2p3/2 peak position of 514.9 eV and an O : V ratio of 1.6 (Fig. S4†). This is consistent with prior reports of vanadium deposition in an oxygen background to create surface oxides.40,47,65 These different experiments show that V atoms in 2D islands do not react in a uniform fashion to form one product.
V-DPTZ chain structure
The formation of V-DPTZ chains on the Au(100) surface was recently reported by our collaboration54 and provides an excellent platform here for the study of chemical activity of metal single-sites. We will briefly review key points of the structural and chemical characterization of those chains before examining their reactivity with O2 gas in the next section, which was not previously studied. DPTZ molecules and V metal were sequentially vapor deposited onto the Au(100) surface in UHV and annealed to form one-dimensional metal–organic chains by an on-surface redox reaction. As described in a previous publication,54 V metal is oxidized to VII when it reacts with DPTZ on the Au(100) surface, as evidenced in XPS by a 1.1 eV shift in the V 2p3/2 binding energy (BE) from 512.7 eV for metallic V to 513.8 eV for VII. A 1D chain structure is formed, illustrated in Scheme 1 and imaged in Fig. 3d. The chains predominately orient themselves at ±43 ± 4° relative to the Au(100) surface reconstruction rows, although some chains grow along the direction of the reconstruction rows. The chains are also straight and uniform, with few kink defects. The redox assembly into this structure does not depend on the deposition order of the metal and the ligand. This structure of formula V-DPTZ is stable against thermal desorption up to at least 200 °C.54 DPTZ was chosen over another possible ligand, bipyrimidinyl tetrazine (BMTZ), because DPTZ is less oxidizing. BMTZ would further deplete reducing power from the attached metal, lowering its potential for high reactivity with added gas.
Fig. 3. XP spectra and STM images showing the reaction of O2 with V-DPTZ chains on Au(100) while holding the surface at 190 °C. (a, b, c) XPS data shown as black points with fit components in green and purple colors and the sum of the fit components as a black line. V oxidized to +2 is shown in (a) before the addition of O2 with a typical STM image showing the 1D chains in (d). XPS of O 1s and V 2p after a 50 L O2 exposure is shown in (b), with the corresponding STM image in (e). In (c), the O 1s and V 2p spectrum after a total of 1500 L O2 is shown, with the corresponding STM image in (f). The vertical green and purple lines indicate V 2p3/2 binding energies for the +2 and +4 oxidation states, respectively.

DFT calculations were carried out for isolated V-DPTZ chain (gas phase) and on the reconstructed Au(100) surface for structural analysis (see Section S2 in ESI† for computational details). For gas phase V-DPTZ chain, our calculations show that the chain structure is entirely planar with distance between two nearest V atoms of ∼6.85 Å. In this chain structure, each V atom has a magnetic moment of ∼3 μB. The V atoms slightly prefer to be in an antiferromagnetic configuration (∼0.01 eV lower energy in the antiferromagnetic than the ferromagnetic configuration). Tetrazines in this planar V-DPTZ chain structure have two short C N and four long intra-ring distances (Fig. 4a), which is different from neutral tetrazine in which there are three long and three short bonds, and is consistent with two localized C N bonds in the 2-electron reduced ring (see Scheme 2). A second diagnostic of reduced tetrazine is that its V–N distances are shorter by 0.05–0.1 Å than those of pyridine in these structures, since dianionic tetrazine, containing amide N, binds to V more strongly than does pyridine N. Additionally, the redox character of the interaction between V and DPTZ is confirmed as the V 2p binding energy is calculated to be 2 eV higher than that of bulk V, indicating an oxidation state of +2, consistent with experimental XPS data.
Fig. 4. Geometries of (a) gas phase V-DPTZ and (b) V-DPTZ on reconstructed Au(100) as obtained by DFT simulations. Gold, gray, blue, white, and green points represent Au, C, N, H, and V, respectively. The red, green, and black insert numbers (Å) are short, long (as shown in Scheme 2) bond lengths within the tetrazine ring and VN bond lengths, respectively.

Scheme 2. Bond lengthening and shortening of 2e– reduction of tetrazine.

For V-DPTZ chain on the hexagonal reconstructed Au(100) surface, our DFT calculations reveal that the VN4 unit is not planar: V is drawn towards the surface out of the N4 plane by 0.43 Å (for comparison, this displacement is only 0.02 Å for Pt–DPTZ on the same surface).66 This results in a V–Au distance of ∼2.59 Å. This is the analog of the strong metal–support interaction observed between metals and oxide supports, but here it originates from direct metal/metal bonding because of the reduced form of our support. Similar to the gas phase chain, bond lengths in the tetrazine ring (Fig. 4b) show the alternating pattern consistent with C N bonds and the remaining CN and NN bonds longer, consistent with single bonds. The bond lengths from V to pyridyl (2.15 Å) are longer than to tetrazine (2.07 Å) because the reduced tetrazines serve as stronger amide donors. It is worth noting that because of the pyramidal VN4 structure, the VN bond lengths are slightly longer than that of gas phase V-DPTZ chain.
The influence of redox-active ligand: V-DPTZ reaction with oxygen on Au(100)
Upon exposure of these V-DPTZ chains to 50 L O2 while holding the surface at 190 °C, the V 2p region undergoes a noticeable change (Fig. 3b). The V 2p region shifts to higher binding energy, as evidenced by a shift in the V 2p3/2 peak by 1.6 eV to 515.4 eV. The FWHM also increases slightly, by 0.3 eV, suggesting that at this stage of the reaction, more than one oxidation state of V is present on the surface. An alternative fitting model that holds the width constant, but allows for more fitting components than Fig. 3b is shown in Fig. S5 (ESI†). An oxygen peak also appears. Based on this evidence, we can conclude that the V is being oxidized to a higher binding energy by reacting with O2. Further O2 exposures were performed on this same surface, reaching total exposures of 500 and 1500 L, holding the surface at 190 °C during each exposure. After 500 L total O2, the O 1s peak intensity increases significantly and the V 2p3/2 peak shifts an additional 0.4 eV to 515.8 eV. After a total O2 exposure of 1500 L, these values remain unchanged. It is important to note that at this point in the experiment that the FWHM has decreased to match the observed value for just V-DPTZ (and for V nanoparticles), suggesting that all of the vanadium has been oxidized, even though the O : V ratio, based on XPS peak areas, is 0.6. It has been discussed previously that sensitivity factors for the 2p lines of transition metals can vary with oxidation state, which makes intensity comparisons difficult.67,68 Based on the narrow peak width and low O : V saturation ratio, we conclude that atomic oxygen binds to every vanadium site. A V 2p3/2 BE of 515.8 eV represents VIV, as this value corresponds to BE values for VIV oxides.69–71 BE values for different V oxidation states are compared in a table in the ESI (Table S1†) showing that the trends we report are consistent with previous research. The N 1s XPS peak is not changed by the O2 reaction, indicating that DPTZ remains dianionic (Fig. S1 and S2†).
Nature of oxygen bound on V-DPTZ chains and reaction mechanism
The observed oxidation of VII to VIV indicates that only one oxygen atom is binding to each V site. This would mean that V dissociates the incoming O2 molecules, establishing a product stoichiometry of (DPTZ)VO rather than (DPTZ)VO2. After 50 L O2 exposure on V-DPTZ, HREEL spectroscopy shows a new peak at 1007 cm–1 (Fig. 5). Previous papers on vanadium complexes report a vanadyl (V O) peak within the range of 960–1033 cm–1.72–74 As O2 exposure increases, the V O peak increases in intensity and dominates the spectrum, but there are also other small changes to the HREEL spectrum, including the appearance of a small shoulder at 845 cm–1 and a slight broadening on the high energy side of the peak at 640 cm–1. These small changes indicate a small fraction of V–O–V bending modes at the surface or possibly some change in the ligand out-of-plane modes as a result of the newly formed V O bond. These are small in population compared to the V O species.
Fig. 5. HREELS of vanadium co-deposited with DPTZ on the Au(100) surface. The V-DPTZ complex was then exposed to increasing amounts of O2 up to 500 L while the surface was held at 190 °C. HREELS was acquired after the annealing was allowed to cool to RT. A vanadyl peak is observed at 1007 cm–1. No other peaks or bending modes are observed. All other peak intensity changes result from intra-ligand electronic and geometric differences after oxygen binding.

DFT calculations provide additional information about the post-reaction product. We have considered a variety of structures for products with one O2 molecule or two O atoms in a supercell (Fig. 6b–j). Of all structures studied, the most stable structure is that with every metal bond being VO (bond length = 1.61 Å), with the O pointing away from gold (Fig. 6j).
Fig. 6. Geometries of (a) V-DPTZ on reconstructed Au(100) and (b–j) different binding configurations of molecular and dissociated O2 on V-DPTZ on reconstructed Au(100) as obtained by DFT simulations. Gold, gray, blue, red, white, and green points represent Au, C, N, O, H, and V, respectively. Binding energies of oxygen are listed on the top-right corner of panels (b–j). Molecular O2 adsorptions are shown in (b) and (c). O2 dissociation and insertion to VN bonds are shown in (d and e). The migration of the O atom across a region of bare Au(100) is shown in (f) and (g). The diffusion of atomic O over tetrazine ring is shown in (h). The most energetically favorable structures, with one O atom per V site, are shown in (i) and (j). Optimized coordinates of these configurations can be found in ESI.† .

This introduces a mechanistic question of how one oxygen atom of O2 arriving at one V reaches the more distant, unoxidized V. The experimentally determined O : V ratio indicates that after the O2 binding at one VII site (Fig. 6b and c) and O O dissociation, there must be migration of one of the O atoms from that site. Eventually, there will be oxidation of each V site by one O that would achieve the most stable binding structure shown in Fig. 6j. To achieve this, we propose two potential O-migration mechanisms. The first potential mechanism would involve the oxygen atom moving across the neighboring tetrazine via a species with O above the center of the ring with two C–O bonds (Fig. 6h), before moving to the other side and reacting with the neighboring, and unoxidized, VII center (Fig. 6j). The second potential mechanism is that one of the oxygen atoms in the V(O)2 species bends closer to the surface (Fig. 6e). This O then migrates to Au (spillover effect, Fig. 6f) ensuing a weak interaction, then diffusing across the surface until it comes in contact with an unreacted VII center (Fig. 6i and j).
Besides the migration along the Au surface to an empty V center (Fig. 6f and g), O atoms also have two potential desorption pathways available. Previous studies of atomic oxygen on Au(111) and Au(110) have shown that at the temperature used in this study (190 °C), mobile O atoms on Au can react with background CO gas (common in UHV systems) to desorb as CO2,75,76 or recombine on the surface to desorb as O2.76–78
A detailed investigation of the thermodynamics and kinetics of all competing reactions of O2 on V-DPTZ chains on the Au(100) surface would provide conclusive information about the mechanism at work. However, the overwhelmingly large system together with the complex nature of the electronic structure of the VO species makes it a daunting task. Fortunately, comparison of energy between considered states (Fig. 6) suggests a strong preference for the formation of V O structure as shown in Fig. 6j, i.e., each V binds one O atom, strongly suggesting that O atoms will find unoccupied V centers should they be available. Since the energy of the intermediate with O bridging the two para carbons on the tetrazine ring (Fig. 6h) is substantially higher than every other configuration, the transfer of the O in a [(VO2)(V)(DPTZ)2]n chain to the neighboring V by migrating over the exo face of the tetrazine (first mechanism) is less favorable than that by migrating across the Au surface (second mechanism). The preferred mechanism occurs through transient insertion of the migrating O into the VN bond (Fig. 6d and e), which illustrates a reverse spillover process, facilitated by a principle from homogenous catalysis: metal ligand cooperation.79
DFT results also indicate that the reaction with O2 does not significantly alter the distances within the DPTZ ligands and VN bond. The distances within tetrazine ring always show two short C N and four other longer bonds, consistent with persistence of doubly reduced tetrazine following Scheme 2, as illustrated in Fig. 7 for two configurations shown in Fig. 6b and j. This confirms what was concluded from XP spectroscopic measurements: addition of O2 to V-DPTZ oxidizes the metal, while leaving the tetrazine reduced. The product also has short VN distances to the tetrazine (∼2.09 Å) and longer VN distances to pyridine (∼2.13 Å). The VO (bond length 1.61 Å) is square pyramidal and pointing perpendicular to the surface. The major effect of oxygen is the upward movement of V atom (as much as 1 Å) upon VO bond formation, implying an important consequence that shall be discussed next.
Fig. 7. Details bond length of (a) O2 molecular adsorption and (b) O atomic adsorption on V-DPTZ on reconstructed Au(100) as obtained by DFT simulations. Gold, gray, blue, red, white, and green points represent Au, C, N, O, H, and V, respectively. The red, green, and black insert numbers (Å) are short, long (as shown in Scheme 2) bond lengths within the tetrazine ring and VN bond lengths, respectively.

Control experiments were conducted to expose either a clean Au(100) surface or DPTZ alone on the surface (no V) to O2. In either case, an O 1s XPS peak was not observed, demonstrating that O2 does not adsorb to or react with either DPTZ or the Au(100) surface at room temperature. O2 does not adsorb or react on clean Au(111) and Au(110) surfaces.76–78
Disruption of chain structure during oxidation
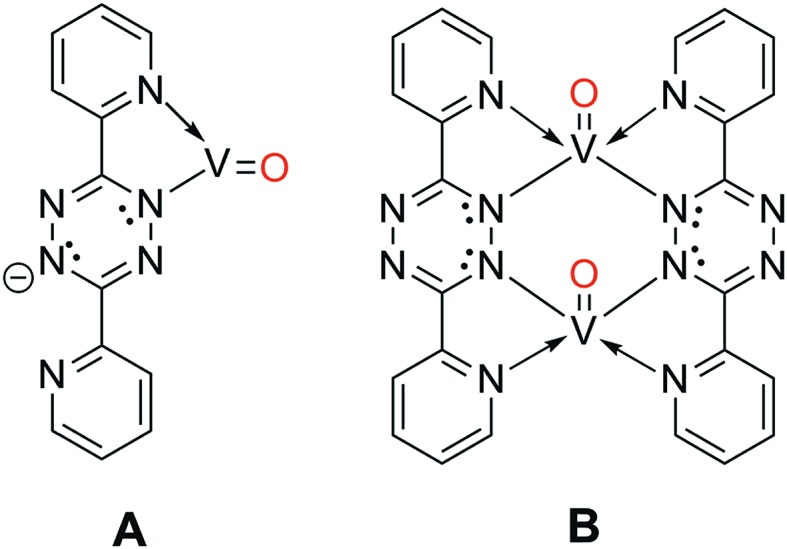
When the O2 exposure is performed while holding the surface at room temperature, STM visualization shows that the 1D V-DPTZ chains are disrupted (Fig. S9†), leaving only a few short chains, mostly near step edges. Some striated features in the image indicate the presence of mobile species that are moving faster than the STM scan rate.80 We can be confident that the DPTZ ligands have not desorbed upon O2 exposure based on XPS signal intensity showing that carbon and nitrogen are still present on the surface at the same concentration as before O2 exposure. Because of the +4 oxidation state of the metal, we can conclude that these mobile species on the surface must be units of formula [(DPTZ)VO]n. A possible explanation for the disruption of the chain structure, and loss of order, is the strong bond that forms between O and V. Through DFT calculations (Fig. 6 and 7), we see that when oxygen binds to the V centers, V moves farther from the surface by 1.0 Å, making the chains generally less fixed, hence less ordered. Shorter chain fragments could form at this step, broken apart locally by the highly exothermic heat of reaction released in this oxidation. Based on the previous discussion, the surface species shown in Scheme 3 (which both contain VIV) are candidates for what is formed, with dimer B more stable since it has a higher, and typical, coordination number for VIV. Such an arrangement has no outwardly directed pyridyl nitrogen lone pairs, so it is not suitable for (and disrupts) chain growth. This could form by binding O2 to one vanadium in Scheme 1, followed by rotation of pyridyl nitrogen. While DPTZ in a crystal lattice, and in our 1D chains, has the pyridyl nitrogens mutually anti,81 molecular structures with two metals, i.e., [DPTZ(M)]2, show that the syn conformer can be adopted.82–86 This efficiently exhausts the full 4 electron oxidizing power of O2 locally, and without high-energy (e.g., oxygen atom) intermediates.
Scheme 3. Potential post-O2 reaction species that form due to the formation of V–O bonds.
Two methods can be used to re-form the chains on the surface. First, annealing the surface, after the oxygen exposure, at temperatures between 170–190 °C, brings back chains (Fig. S9†). These chains have a similar structure as before the reaction with O2, but now each V center has an oxygen atom bound to it. The second method involves heating the surface during the oxygen exposure. In this case, chains are observed by STM immediately upon imaging after the exposure. In either case, it is clear that thermal energy is needed for chains to form after the reaction with O2.
In both cases, there are some clear differences in the chain structure after the reaction with oxygen compared to the V-DPTZ chains before the reaction. The main difference is that the chains show less preferential orientation with respect to the gold surface. The chains do not show a preferred 43° angle of orientation with respect to the reconstruction rows, and instead show many different orientations, including an increased number of chains growing along the rows. Also, the chains are much less straight and uniform, showing a greater number of bends and kinks, which were not present before the reaction with oxygen. DFT calculations can provide some insight into these structural differences. Before the reaction, the V atoms were close to the surface, positioned below the plane of the DPTZ molecules (Fig. 6), showing a relatively strong interaction with the surface. After the reaction, the V atoms rise from the surface by an additional 1.0 Å to 3.60 Å, moving above the plane of the DPTZ molecules and towards the oxo, thus removing the Au/V interaction. This effect of adsorbed gas species weakening the metal-surface bond has been observed before through DFT calculations,30 but the effect is much larger here. VIV complexes are known to prefer square pyramidal geometries over octahedral geometries,87,88 so it is reasonable to assume that the oxo bonding on the V sites would weaken bonding at the trans position, i.e., weaken the V interaction to the gold surface. This weakened interaction with the surface would account for the increased mobility. It also weakens the stabilization of V atoms in good registry with the surface to make the chains less rigid, allowing for increased bending along the chains, and also allows for less regular registry with the surface.
This study clearly shows that ligand design can have a major influence on selectivity, and opens a broader study of spillover effects and migration mechanisms for substrate atoms between surface-bound single-site metals too far apart to allow concerted M2 interaction with substrate. Catalysts benefit from not only metal choice, but also ligand design as tools to achieve improved performance.
Conclusion
In this work, we have shown that the V metal centers in 1D V-DPTZ chains on Au(100) are available for reactivity, and that O2 molecules undergo bond cleavage resulting in one of the oxygen atoms bonded to the V metal center to form V O and spillover of the other O to the Au surface to migrate and react with another metal center. We have also shown that DPTZ is necessary to fully oxidize the V to VIV. This must be both a structural effect and the influence of charge donation by nitrogen lone pairs; when DPTZ is reduced (dianionic), its nitrogens are strong donors, which increases the reducing power of the attached metal. Utilizing HREELS, the identity of the V–O binding species could be determined. While only a single peak grows with the V-DPTZ for a vanadyl O species, multiple vibrational modes appear when O2 is exposed to V nanoparticles, showing the formation of a vanadyl V O species in addition to V–O–V bending modes. DFT calculations confirmed the preferred bonding structure of one oxygen atom per V site. Additionally, they revealed details regarding the mechanism of the reaction, indicating a likely mechanism involving the insertion of O into a VN bond followed by migration of O across the surface.
These results show that the presence of redox active N-heterocyclic ligands has a noticeable effect on the chemistry of metals on surfaces. In addition, metal atom vaporization here permits exploring ligand-poor (1 : 1 stoichiometry) complexes derived from metal atoms, the latter nearly impossible to access in molecular chemistry in solution. This is a clear demonstration of the uniformity, and high selectivity, that on-surface single-site metal centers have. Studying an increasing variety of metals and ligands is an important next step in understanding the chemistry and potential reactivity of metal–ligand networks on surfaces and their impact for future applications in catalysis and gas capture. Using knowledge from molecular chemistry, including trends in donor power and redox character of both metals and ligands, rational control of selectivity can be envisioned.
Conflicts of interest
There are no conflicts of interest to declare.
Supplementary Material
Acknowledgments
The authors thank Brian J. Cook for helpful discussions. The STM and XPS studies at Indiana University were supported by a collaborative grant from the National Science Foundation, CHE-1610984. HREELS studies at IU were supported by the U. S. Department of Energy, Office of Basic Energy Sciences, Chemical Sciences program, DE-SC0016367. DFT calculations were supported in part by the National Science Foundation Grant CHE-1310327 and were performed using resource from the Extreme Science and Engineering Discovery Environment (XSEDE) and the Advanced Research Computing Center at UCF. CDT thanks the Siedle Foundation for support. DLW thanks the NSWC Crane Fellowship program for funding.
Footnotes
†Electronic supplementary information (ESI) available. See DOI: 10.1039/c7sc04752e
References
- Pike S. D., Weller A. S. Philos. Trans. R. Soc., A. 2015;373:20140187. doi: 10.1098/rsta.2014.0187. [DOI] [PMC free article] [PubMed] [Google Scholar]
- Lee J., Farha O. K., Roberts J., Scheidt K. A., Nguyen S. T., Hupp J. T. Chem. Soc. Rev. 2009;38(5):1450–1459. doi: 10.1039/b807080f. [DOI] [PubMed] [Google Scholar]
- Furukawa H., Cordova K. E., O'Keeffe M., Yaghi O. M. Science. 2013;341:1230444. doi: 10.1126/science.1230444. [DOI] [PubMed] [Google Scholar]
- Poryvaev A. S., Sheveleva A. M., Kolokolov D. I., Stepanov A. G., Bagryanskaya E. G., Fedin M. V. J. Phys. Chem. C. 2016;120(19):10698–10704. [Google Scholar]
- Rogge S. M. J., Bavykina A., Hajek J., Garcia H., Olivos-Suarez A. I., Sepulveda-Escribano A., Vimont A., Clet G., Bazin P., Kapteijn F., Daturi M., Ramos-Fernandez E. V., Llabres i Xamena F. X., Van Speybroeck V., Gascon J. Chem. Soc. Rev. 2017;46(11):3134–3184. doi: 10.1039/c7cs00033b. [DOI] [PMC free article] [PubMed] [Google Scholar]
- Liu J., Lucci F. R., Yang M., Lee S., Marcinkowski M. D., Therrien A. J., Williams C. T., Sykes E. C. H., Flytzani-Stephanopoulos M. J. Am. Chem. Soc. 2016;138(20):6396–6399. doi: 10.1021/jacs.6b03339. [DOI] [PubMed] [Google Scholar]
- Lucci F. R., Darby M. T., Mattera M. F. G., Ivimey C. J., Therrien A. J., Michaelides A., Stamatakis M., Sykes E. C. H. J. Phys. Chem. Lett. 2016;7(3):480–485. doi: 10.1021/acs.jpclett.5b02400. [DOI] [PubMed] [Google Scholar]
- Wang C. Y., Garbarino G., Allard L. F., Wilson F., Busca G., Flytzani-Stephanopoulos M. ACS Catal. 2016;6(1):210–218. [Google Scholar]
- Kim J., Kim H.-E., Lee H. ChemSusChem. 2017 doi: 10.1002/cssc.201701306. [DOI] [Google Scholar]
- Liu J., Bunes B. R., Zang L., Wang C. Environ. Chem. Lett. 2017 doi: 10.1007/s10311-017-0679-2. [DOI] [Google Scholar]
- Wilton-Ely J. D. E. T. Dalton Trans. 2008;1:25–29. doi: 10.1039/b714144k. [DOI] [PubMed] [Google Scholar]
- Rumberger E. M. W., Ahn H. S., Bell A. T., Tilley T. D. Dalton Trans. 2013;42(34):12238–12247. doi: 10.1039/c3dt51472b. [DOI] [PubMed] [Google Scholar]
- Jones C. W., McKittrick M. W., Nguyen J. V., Yu K. Q. Top. Catal. 2005;34(1–4):67–76. [Google Scholar]
- Moses A. W., Raab C., Nelson R. C., Leifeste H. D., Ramsahye N. A., Chattopadhyay S., Eckert J., Chmelka B. F., Scott S. L. J. Am. Chem. Soc. 2007;129(28):8912–8920. doi: 10.1021/ja072707s. [DOI] [PubMed] [Google Scholar]
- Vicente B. C., Huang Z., Brookhart M., Goldman A. S., Scott S. L. Dalton Trans. 2011;40(16):4268–4274. doi: 10.1039/c0dt01369b. [DOI] [PubMed] [Google Scholar]
- Huang Z., Brookhart M., Goldman A. S., Kundu S., Ray A., Scott S. L., Vicente B. C. Adv. Synth. Catal. 2009;351(1–2):188–206. [Google Scholar]
- Pelletier J. D. A., Basset J.-M. Acc. Chem. Res. 2016;49(4):664–677. doi: 10.1021/acs.accounts.5b00518. [DOI] [PubMed] [Google Scholar]
- Copéret C., Comas-Vives A., Conley M. P., Estes D. P., Fedorov A., Mougel V., Nagae H., Núñez-Zarur F., Zhizhko P. A. Chem. Rev. 2016;116(2):323–421. doi: 10.1021/acs.chemrev.5b00373. [DOI] [PubMed] [Google Scholar]
- Thomas J. M., Raja R., Lewis D. W. Angew. Chem., Int. Ed. 2005;44(40):6456–6482. doi: 10.1002/anie.200462473. [DOI] [PubMed] [Google Scholar]
- Yang X.-F., Wang A., Qiao B., Li J., Liu J., Zhang T. Acc. Chem. Res. 2013;46(8):1740–1748. doi: 10.1021/ar300361m. [DOI] [PubMed] [Google Scholar]
- Auwärter W., Weber-Bargioni A., Brink S., Riemann A., Schiffrin A., Ruben M., Barth J. V. ChemPhysChem. 2007;8(2):250–254. doi: 10.1002/cphc.200600675. [DOI] [PubMed] [Google Scholar]
- Tait S. L., Wang Y., Costantini G., Lin N., Baraldi A., Esch F., Petaccia L., Lizzit S., Kern K. J. Am. Chem. Soc. 2008;130(6):2108–2113. doi: 10.1021/ja0778186. [DOI] [PubMed] [Google Scholar]
- Skomski D., Tempas C. D., Bukowski G. S., Smith K. A., Tait S. L. J. Chem. Phys. 2015;142:101913. doi: 10.1063/1.4906894. [DOI] [PubMed] [Google Scholar]
- Yang H. H., Chu Y. H., Lu C. I., Yang T. H., Yang K. J., Kaun C. C., Hoffmann G., Lin M. T. ACS Nano. 2013;7(3):2814–2819. doi: 10.1021/nn4003715. [DOI] [PubMed] [Google Scholar]
- Abdurakhmanova N., Floris A., Tseng T. C., Comisso A., Stepanow S., De Vita A., Kern K. Nat. Commun. 2012;3:940. doi: 10.1038/ncomms1942. [DOI] [PubMed] [Google Scholar]
- Takulapalli B. R., Laws G. M., Liddell P. A., Andreasson J., Erno Z., Gust D., Thornton T. J. J. Am. Chem. Soc. 2008;130(7):2226–2233. doi: 10.1021/ja076328a. [DOI] [PubMed] [Google Scholar]
- Skomski D., Tempas C. D., Smith K. A., Tait S. L. J. Am. Chem. Soc. 2014;136(28):9862–9865. doi: 10.1021/ja504850f. [DOI] [PubMed] [Google Scholar]
- Williams C. G., Wang M., Skomski D., Tempas C. D., Kesmodel L. L., Tait S. L. J. Phys. Chem. C. 2017;121(24):13183–13190. [Google Scholar]
- Le D., Rahman T. S. Faraday Discuss. 2017;204:83–95. doi: 10.1039/c7fd00097a. [DOI] [PubMed] [Google Scholar]
- Hieringer W., Flechtner K., Kretschmann A., Seufert K., Auwärter W., Barth J. V., Görling A., Steinrück H. P., Gottfried J. M. J. Am. Chem. Soc. 2011;133(16):6206–6222. doi: 10.1021/ja1093502. [DOI] [PubMed] [Google Scholar]
- Feng M., Sun H., Zhao J., Petek H. ACS Nano. 2014;8(8):8644–8652. doi: 10.1021/nn5035026. [DOI] [PubMed] [Google Scholar]
- Murphy B. E., Krasnikov S. A., Sergeeva N. N., Cafolla A. A., Preobrajenski A. B., Chaika A. N., Lubben O., Shvets I. V. ACS Nano. 2014;8(5):5190–5198. doi: 10.1021/nn501240j. [DOI] [PubMed] [Google Scholar]
- Fabris S., Stepanow S., Lin N., Gambardella P., Dmitriev A., Honolka J., Baroni S., Kern K. Nano Lett. 2011;11(12):5414–5420. doi: 10.1021/nl2031713. [DOI] [PubMed] [Google Scholar]
- Amadio E., Di Lorenzo R., Zonta C., Licini G. Coord. Chem. Rev. 2015;301:147–162. [Google Scholar]
- Licini G., Conte V., Coletti A., Mba M., Zonta C. Coord. Chem. Rev. 2011;255(19–20):2345–2357. [Google Scholar]
- Artiglia L., Agnoli S., Granozzi G. Coord. Chem. Rev. 2015;301:106–122. [Google Scholar]
- Beke S. Thin Solid Films. 2011;519(6):1761–1771. doi: 10.1016/j.tsf.2010.10.054. [DOI] [PMC free article] [PubMed] [Google Scholar]
- Carrero C. A., Schloegl R., Wachs I. E., Schomaecker R. ACS Catal. 2014;4(10):3357–3380. [Google Scholar]
- Bond G. C., Tahir S. F. Appl. Catal. 1991;71(1):1–31. [Google Scholar]
- Surnev S., Kresse G., Ramsey M. G., Netzer F. P. Phys. Rev. Lett. 2001;87(8):086102. doi: 10.1103/PhysRevLett.87.086102. [DOI] [PubMed] [Google Scholar]
- Baumer M., Biener J., Madix R. J. Surf. Sci. 1999;432(3):189–198. [Google Scholar]
- Madix R. J., Biener J., Baumer M., Dinger A. Faraday Discuss. 1999;114:67–84. [Google Scholar]
- Niehus H., Blum R. P., Ahlbehrendt D. Phys. Status Solidi A. 2001;187(1):151–159. [Google Scholar]
- Lewis K. B., Oyama S. T., Somorjai G. A. Surf. Sci. 1990;233(1–2):75–83. [Google Scholar]
- Abu Haija M., Guimond S., Romanyshyn Y., Uhl A., Kuhlenbeck H., Todorova T. K., Ganduglia-Pirovano M. V., Dobler J., Sauer J., Freund H. J. Surf. Sci. 2006;600(7):1497–1503. [Google Scholar]
- Stavale F., Niehus H., Achete C. A. Surf. Sci. 2009;603(17):2721–2724. [Google Scholar]
- Krenn G., Schoiswohl J., Surnev S., Netzer F. P., Schennach R. Top. Catal. 2007;46(1–2):231–238. [Google Scholar]
- Sedai B., Diaz-Urrutia C., Baker R. T., Wu R. L., Silks L. A., Hanson S. K. ACS Catal. 2011;1(7):794–804. [Google Scholar]
- Wachs I. E. Dalton Trans. 2013;42(33):11762–11769. doi: 10.1039/c3dt50692d. [DOI] [PubMed] [Google Scholar]
- Huang T. Z., Yu J. M., Han J. T., Zhang Z. L., Xing Y., Wen C. L., Wu X. Y., Zhang Y. H. J. Power Sources. 2015;300:483–490. [Google Scholar]
- Eguchi K., Nakagawa T., Takagi Y., Yokoyama T. J. Phys. Chem. C. 2015;119(18):9805–9815. [Google Scholar]
- Rochford L. A., Hancox I., Jones T. S. Surf. Sci. 2014;628:62–65. [Google Scholar]
- Adler H., Paszkiewicz M., Uihlein J., Polek M., Ovsyannikov R., Basova T. V., Chasse T., Peisert H. J. Phys. Chem. C. 2015;119(16):8755–8762. [Google Scholar]
- Skomski D., Tempas C. D., Cook B. J., Polezhaev A. V., Smith K. A., Caulton K. G., Tait S. L. J. Am. Chem. Soc. 2015;137(24):7898–7902. doi: 10.1021/jacs.5b03706. [DOI] [PubMed] [Google Scholar]
- Botto I. L., Vassallo M. B., Baran E. J., Minelli G. Mater. Chem. Phys. 1997;50(3):267–270. [Google Scholar]
- Vyboishchikov S. F., Sauer J. J. Phys. Chem. A. 2001;105(37):8588–8598. [Google Scholar]
- Vanhove M. A., Koestner R. J., Stair P. C., Bibérian J. P., Kesmodel L. L., Bartoš I., Somorjai G. A. Surf. Sci. 1981;103(1):189–217. [Google Scholar]
- Tempas C. D., Skomski D., Tait S. L. Surf. Sci. 2016;654:33–38. [Google Scholar]
- Binnig G. K., Rohrer H., Gerber C., Stoll E. Surf. Sci. 1984;144(2–3):321–335. [Google Scholar]
- Kesmodel L. L., High-resolution Electron Energy Loss Spectroscopy, in Encyclopedia of Surface and Colloid Science, ed. P. Somasundaren, Taylor and Francis, New York, 2nd edn, 2006. [Google Scholar]
- Ibach H., Physics of Surfaces and Interfaces, Springer, Berlin, 2006. [Google Scholar]
- Shigesato Y., Enomoto M., Odaka H. Jpn. J. Appl. Phys. 2000;39(10):6016–6024. [Google Scholar]
- Menezes W. G., Reis D. M., Benedetti T. M., Oliveira M. M., Soares J. F., Torresi R. M., Zarbin A. J. J. Colloid Interface Sci. 2009;337(2):586–593. doi: 10.1016/j.jcis.2009.05.050. [DOI] [PubMed] [Google Scholar]
- Hansen T. W., Delariva A. T., Challa S. R., Datye A. K. Acc. Chem. Res. 2013;46(8):1720–1730. doi: 10.1021/ar3002427. [DOI] [PubMed] [Google Scholar]
- Leisenberger F. P., Surnev S., Vitali L., Ramsey M. G., Netzer F. P. J. Vac. Sci. Technol., A. 1999;17(4):1743–1749. [Google Scholar]
- Le D., Rahman T. S. Faraday Discuss. 2017;204:83–95. doi: 10.1039/c7fd00097a. [DOI] [PubMed] [Google Scholar]
- Silversmit G., Depla D., Poelman H., Marin G. B., De Gryse R. J. Electron Spectrosc. Relat. Phenom. 2004;135(2–3):167–175. [Google Scholar]
- Wagner C. D., Davis L. E., Zeller M. V., Taylor J. A., Raymond R. H., Gale L. H. Surf. Interface Anal. 1981;3(5):211–225. [Google Scholar]
- Colton R. J., Guzman A. M., Rabalais J. W. J. Appl. Phys. 1978;49(1):409–416. [Google Scholar]
- Hoang T. K. A., Webb M. I., Mai H. V., Hamaed A., Walsby C. J., Trudeau M., Antonelli D. M. J. Am. Chem. Soc. 2010;132(33):11792–11798. doi: 10.1021/ja104926h. [DOI] [PubMed] [Google Scholar]
- Feng X., Abdel-Rahman M. K., Kruppe C. M., Trenary M. Surf. Sci. 2017;664:1–7. [Google Scholar]
- Sutradhar M., Barman T. R., Mukherjee G., Drew M. G. B., Ghosh S. Inorg. Chim. Acta. 2010;363(13):3376–3383. [Google Scholar]
- Gajera S. B., Mehta J. V., Kanthecha D. N., Patel R. R., Patel M. N. Appl. Organomet. Chem. 2017;31:e3767. [Google Scholar]
- Yamashita K., Tazawa S., Sugiura K. Inorg. Chim. Acta. 2016;439:173–177. [Google Scholar]
- Min B. K., Alemozafar A. R., Pinnaduwage D., Deng X., Friend C. M. J. Phys. Chem. B. 2006;110(40):19833–19838. doi: 10.1021/jp0616213. [DOI] [PubMed] [Google Scholar]
- Hiebel F., Montemore M. M., Kaxiras E., Friend C. M. Surf. Sci. 2016;650:5–10. [Google Scholar]
- Deng X. Y., Min B. K., Guloy A., Friend C. M. J. Am. Chem. Soc. 2005;127(25):9267–9270. doi: 10.1021/ja050144j. [DOI] [PubMed] [Google Scholar]
- Min B. K., Alemozafar A. R., Biener M. M., Biener J., Friend C. M. Top. Catal. 2005;36(1–4):77–90. [Google Scholar]
- Khusnutdinova J. R., Milstein D. Angew. Chem., Int. Ed. 2015;54(42):12236–12273. doi: 10.1002/anie.201503873. [DOI] [PubMed] [Google Scholar]
- Antczak G., Boom K., Morgenstern K. J. Phys. Chem. C. 2017;121(1):542–549. [Google Scholar]
- Klein A., McInnes E. J. L., Scheiring T., Zalis S. J. Chem. Soc., Faraday Trans. 1998;94(19):2979–2984. [Google Scholar]
- Constable E. C., Housecroft C. E., Kariuki B. M., Kelly N., Smith C. B. Inorg. Chem. Commun. 2002;5(3):199–202. [Google Scholar]
- Dai F. R., Ye H. Y., Li B., Zhang L. Y., Chen Z. N. Dalton Trans. 2009;40:8696–8703. doi: 10.1039/b908798b. [DOI] [PubMed] [Google Scholar]
- Schottel B. L., Chifotides H. T., Shatruk M., Chouai A., Perez L. M., Bacsa J., Dunbar K. R. J. Am. Chem. Soc. 2006;128(17):5895–5912. doi: 10.1021/ja0606273. [DOI] [PubMed] [Google Scholar]
- Constable E. C., Housecroft C. E., Neuburger M., Reymann S., Schaffner S. CrystEngComm. 2008;10(8):991–995. [Google Scholar]
- Maekawa M., Miyazaki T., Sugimoto K., Okubo T., Kuroda-Sowa T., Munakata M., Kitagawa S. Dalton Trans. 2013;42(12):4258–4266. doi: 10.1039/c2dt32649c. [DOI] [PubMed] [Google Scholar]
- Thompson K. H., Orvig C. Coord. Chem. Rev. 2001;219:1033–1053. [Google Scholar]
- Nicholls D. Coord. Chem. Rev. 1966;1:379–414. [Google Scholar]
Associated Data
This section collects any data citations, data availability statements, or supplementary materials included in this article.