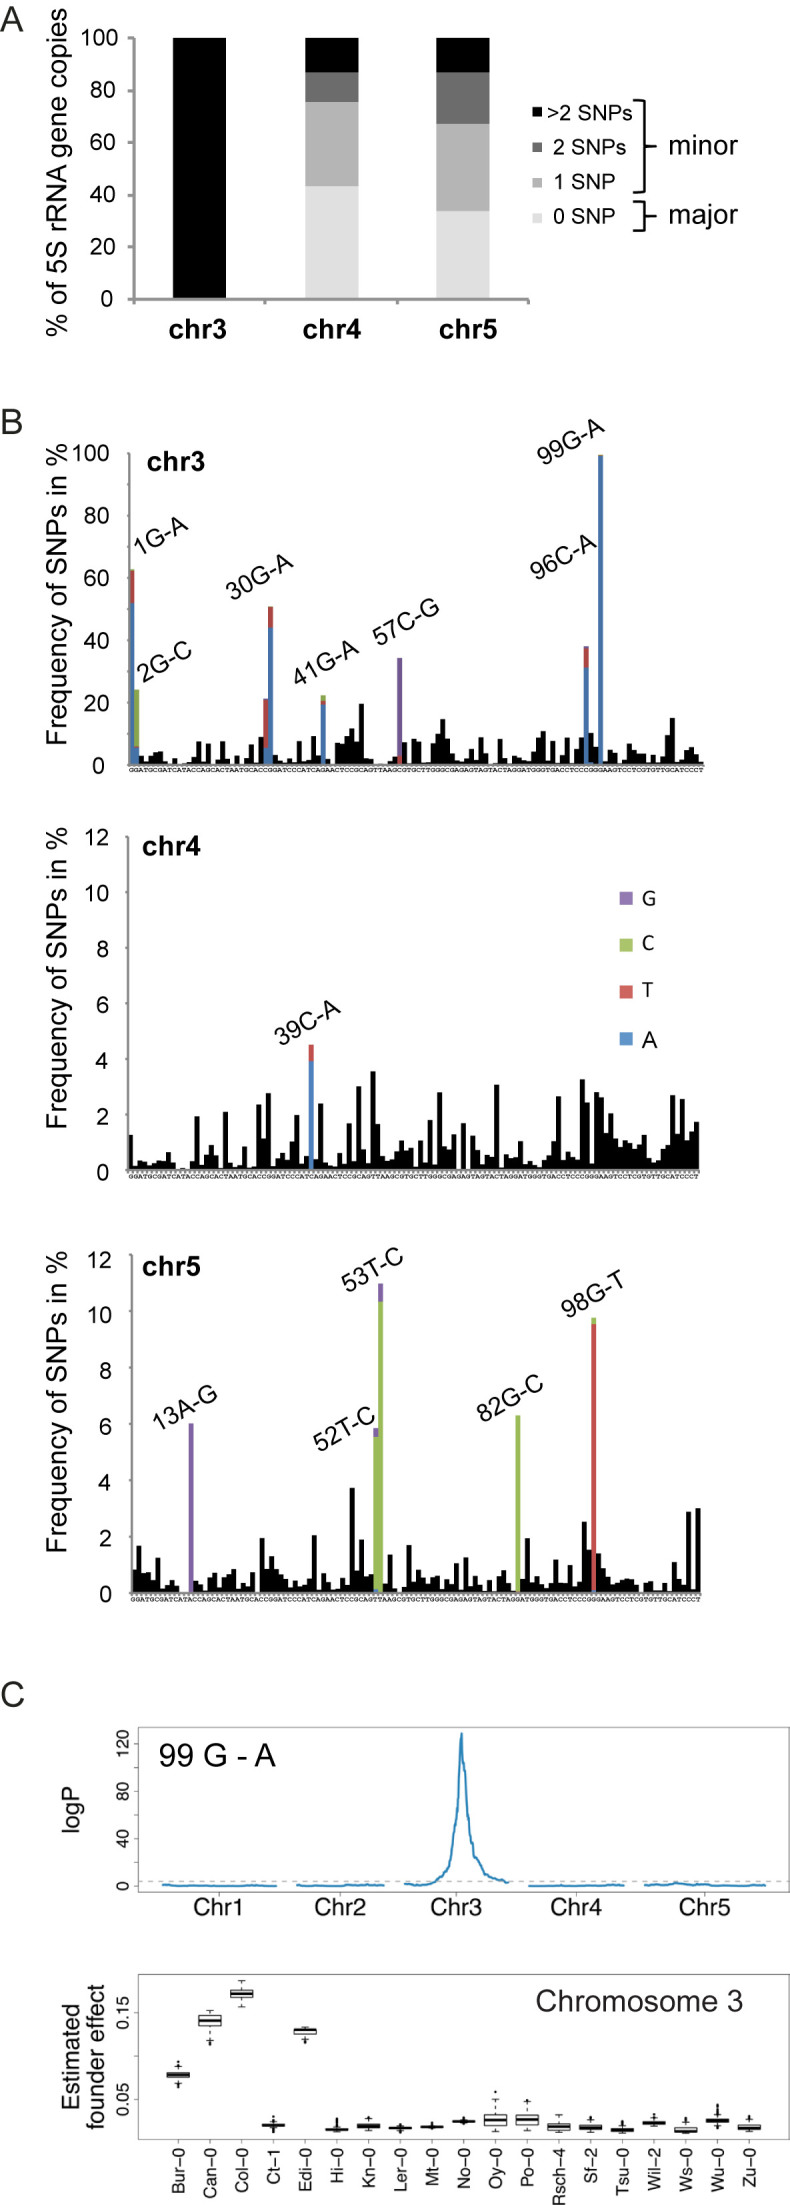
Figure 2.

Chromosome specific single nucleotide polymorphisms. (A) Percentage of 5S rRNA gene copies assigned to chromosomes 3, 4 and 5 with 0 (major 5S rRNA genes), 1, 2 and more than 2 polymorphisms (minor 5S rRNA genes) in the transcribed sequence relative to the 5S rRNA consensus sequence. (B) Frequency of single nucleotide polymorphisms (SNPs) along the 120 bp transcribed sequence determined from the Mi-Seq NGS dataset. For the most frequent SNPs, the exchanged nucleotide at the given position is indicated in color. The consensus sequence is indicated below each graph. (C) (Top) Linkage mapping of the abundance of the G to A single nucleotide polymorphism at position 99 estimated by NGS in 393 individuals of the MAGIC population. (Bottom) Boxplot of the estimated founder ecotype effect by multiple imputation using R/happy at the major quantitative trait locus from the top panel in chromosome 3.
