Figure 3.
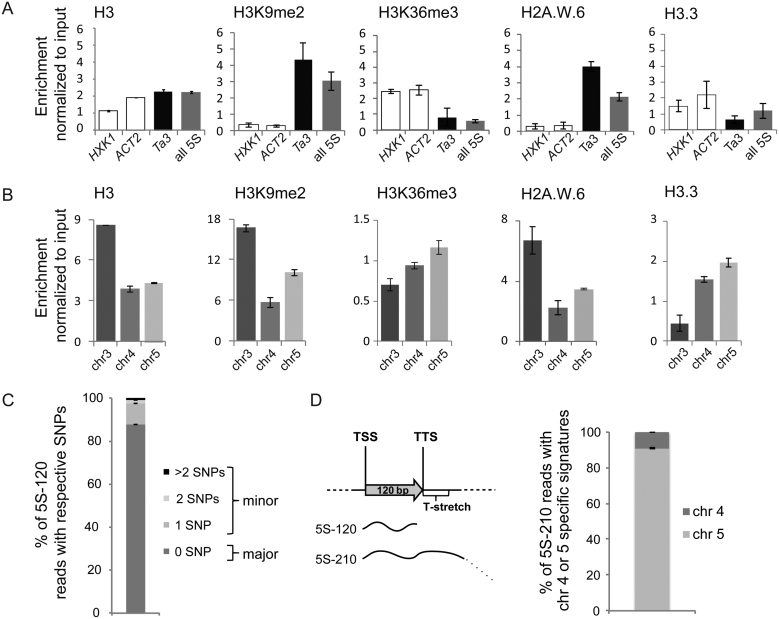
Epigenetic marks and expression of 5S rRNA genes. (A and B) Nucleosome occupancy estimated by H3-ChIP and enrichment in histone post-translational modifications (H3K9me2 and H3K36me3) as well as histone variants H2A.W.6 and H3.3 at (A) the transcriptionally active genes HEXOKINASE1 (HXK1, At4g29130) and ACTIN2 (ACT2, At3g18780), the retrotransposon Ta3 and the 120 bp transcribed sequence of a 5S rRNA gene or (B) at the 3 different 5S rDNA loci. The y-axis corresponds to the number of reads in the ChIP-seq datasets normalized to the number of reads in input datasets. (C) Mean percentage of 5S rRNA transcripts with 0 (major 5S rRNA genes) or 1, 2 and more than 2 single nucleotide polymorphisms (minor 5S rRNA genes) determined in RNA-seq datasets from 3 biological replicates of 2-day-old Col-0 seedlings. (D) Left: Schematic representation of the 5S-120 and the 5S-210 transcripts. Right: Mean percentage of 5S-210 reads with the chromosome 4 or chromosome 5 specific T-stretch signatures determined in RNA-seq datasets prepared from 2-day old seedlings in three biological replicates. For all panels the error bar corresponds to SEM.

