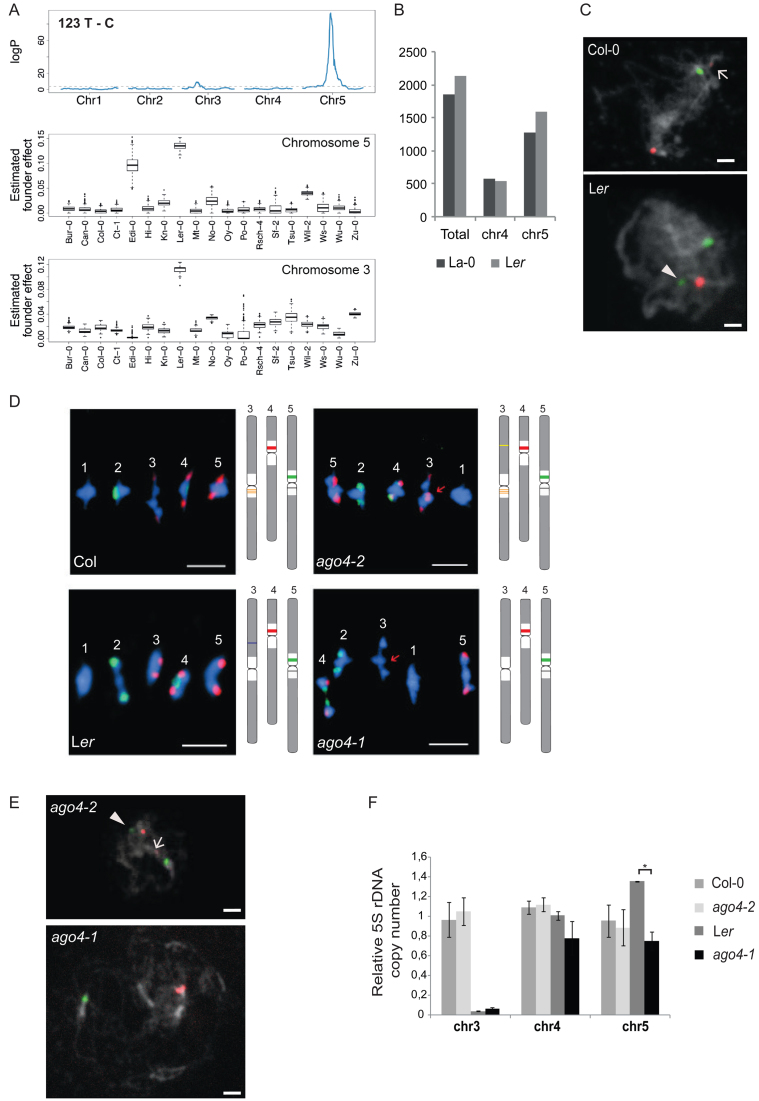
Figure 5.
Variations of 5S rDNA copy number and genomic position. (A) (Top) Linkage mapping of the abundance of the T to C single nucleotide polymorphism at position 123 estimated by NGS in 393 individuals of the MAGIC population. (Bottom) Boxplots of the estimated founder ecotype effect by multiple imputation using R/happy at the major quantitative trait locus from the top panel in chromosome 5 and chromosome 3. (B) Number of total 5S rRNA genes and genes with chromosome 4 or 5 specific T-stretch signatures as determined by in silico analysis of La-0 and Ler Illumina sequencing datasets. (C) FISH using LNA-DNA mixmer probes specific for chromosome 4 (red) and chromosome 5 (green) on pachytene spreads of Col-0 and Ler. DNA is counterstained by DAPI (in grey). Arrow indicates weak cross hybridization of the chromosome 4 probe to the 5S rRNA gene copies from chromosome 3. Arrowhead indicates the 5S locus on the long arm of bivalent 3 in Ler. The scale bar presents 5 μM. (D) FISH with 5S (red) and 45S (green) rDNA probes on metaphase I bivalents of Col-0, Ler and the ago4 mutant alleles, ago4-2 (Col-0 background) and ago4-1 (Ler background). The scale bar presents 5 μM. (E) FISH on ago4-2 and ago4-1 pachytene spreads with LNA-DNA mixmer probes as in (C). Arrow indicates weak cross hybridization of the chromosome 4 probe with the 5S rRNA gene copies of chromosome 3 in ago4-2. Arrowhead designates the additional locus (green) on the long arm of bivalent 3 in ago4-2. The locus on the long arm of bivalent 3 in Ler is lost in ago4-1. The scale bar presents 5 μM. (F) Relative 5S rDNA copy number for each locus in Col-0, ago4-2, Ler and ago4-1 determined by qPCR in three biological replicates. Copy numbers in Col-0 are set to 1 for each chromosome. *P < 0.05, ANOVA.

