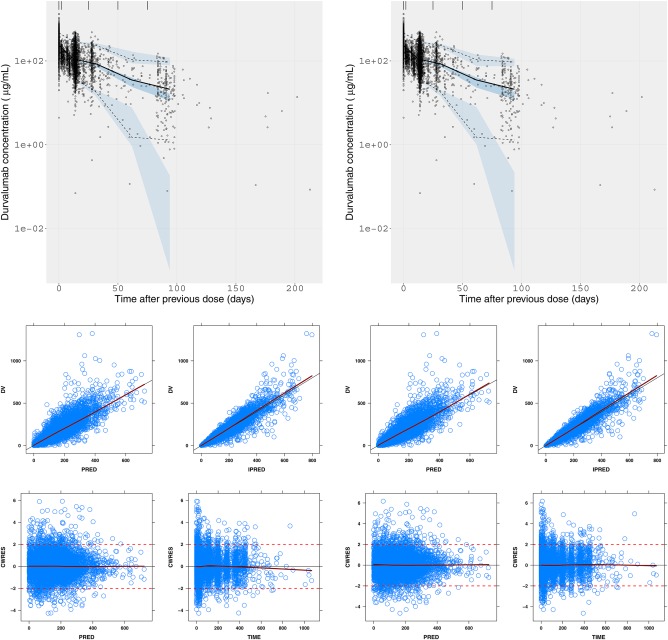
Figure 1.

Left panels: Empirical time‐varying CL model. Right panels: Semimechanistic time‐varying CL model, where, Top: VPC (10 mg/kg q2w i.v.); Bottom: Goodness‐of‐fit (all dose levels). Dark blue: smoother line. Red dotted line: indicators of –2 and 2 conditional weighted residuals. Black lines: line of identity. CWRES, conditional weighted residues; DV, data value; IPRED, individual prediction; i.v., intravenous; PRED, population predicted; q2w, every 2 weeks; VPC, visual predictive check. [Color figure can be viewed at http://www.cpt-journal.com]
