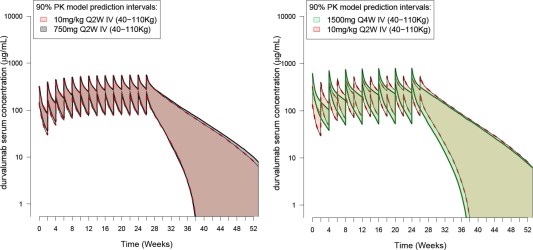
Figure 4.

Simulated PK profiles of durvalumab following weight‐based dosing regimens (10 mg/kg q2w i.v.) compared with flat‐dosing. (a) 750 mg q2w i.v.; (b) 1,500 mg q4w i.v. The area (pink, gray, and green) represents the 90% prediction interval from the semimechanistic time‐varying CL model according to three different dosing schemes; they are delimited by the 5th and 95th percentiles of the simulated PK data obtained from a pool of n = 1,000 virtual patients. Only the body weight covariate effect was investigated (no time‐varying covariate were used for simulations). [Color figure can be viewed at http://www.cpt-journal.com]
