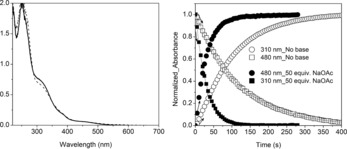
Figure 3.

Left: UV/Vis absorption spectrum of 2 in methanol (solid line) and after the addition of NaOAc (50 equiv; dashed line). Right: Comparison of normalized absorbance at 310 and 480 nm over time under irradiation (λ exc=365 nm) with (closed circles and squares) and without (open circles and squares) NaOAc (6.25 mm).
