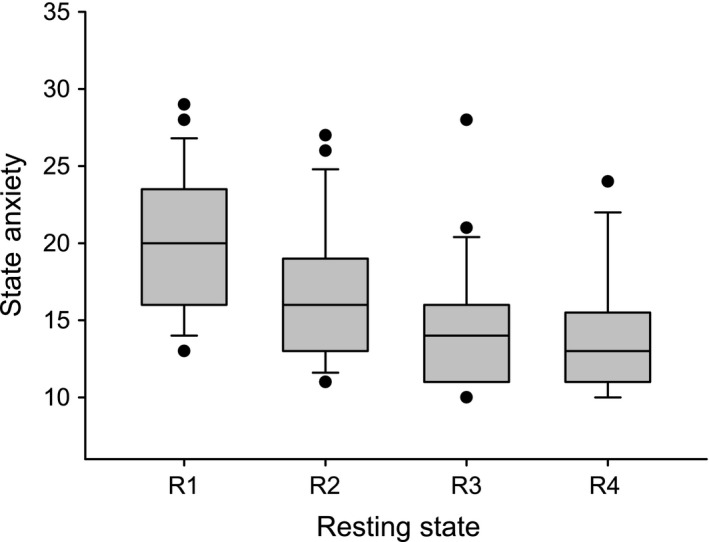
Figure 1.

Boxplot depicting the distribution of state anxiety across the four resting states (R1–R4). State anxiety significantly declined throughout the resting states with all comparisons being significant (P < 0.05), except R3–R4 (P = 0.16). Note: whiskers indicate the 10th and 90th percentile.
