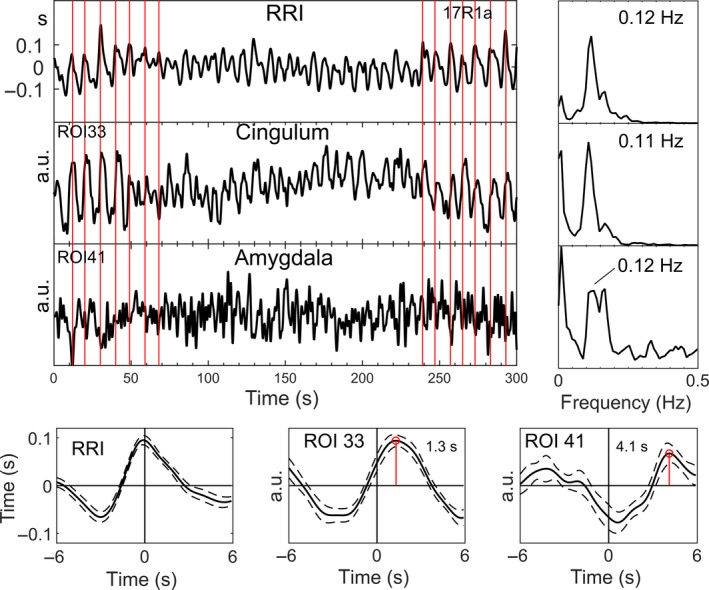
Figure 6.

Time courses of RRI and BOLD signals from MCC and amygdala (top left), power spectra (top right) and RRI peak‐triggered averages (± SE; bottom) of RRI and BOLD signals from one subject (s17) with neural BOLD oscillations (pTD) in rest R1. The vertical lines indicate the triggers. The 0.12‐Hz oscillations in amygdala are superimposed by a signal with dominant 0.17‐Hz rhythm. [Colour figure can be viewed at wileyonlinelibrary.com].
