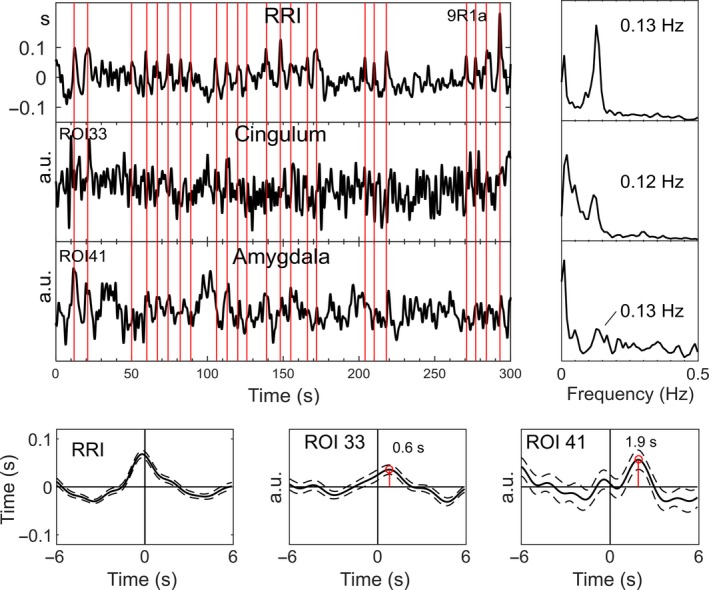
Figure 7.

Time courses, signals and spectra from subject s9. For further explanation, see Fig. 6. The 0.13‐Hz oscillations in the amygdala are distinguishable, lagged to RRI and cingulum BOLD and are disturbed by other oscillations. [Colour figure can be viewed at wileyonlinelibrary.com].
