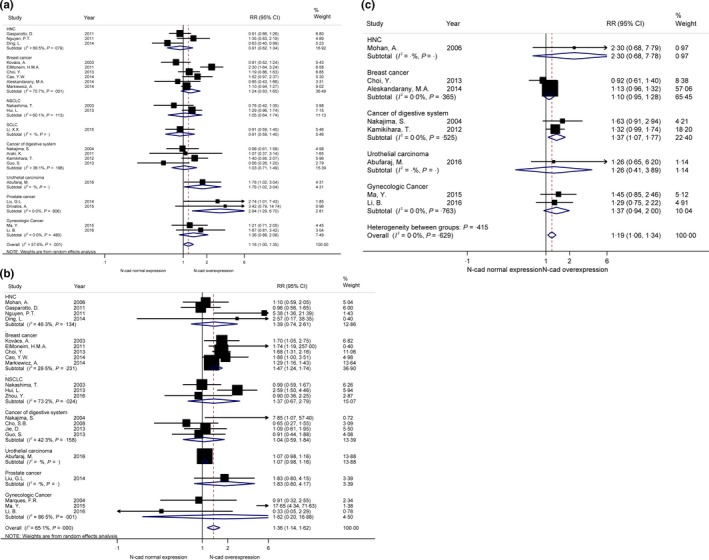
Figure 2.

Forrest plots of risk ratios (RRs) for correlation between N‐cadherin upregulation and clinicopathological features. A, Lymph node metastasis; B, histological grade; C, angiolymphatic invasion

Forrest plots of risk ratios (RRs) for correlation between N‐cadherin upregulation and clinicopathological features. A, Lymph node metastasis; B, histological grade; C, angiolymphatic invasion