Figure 3.

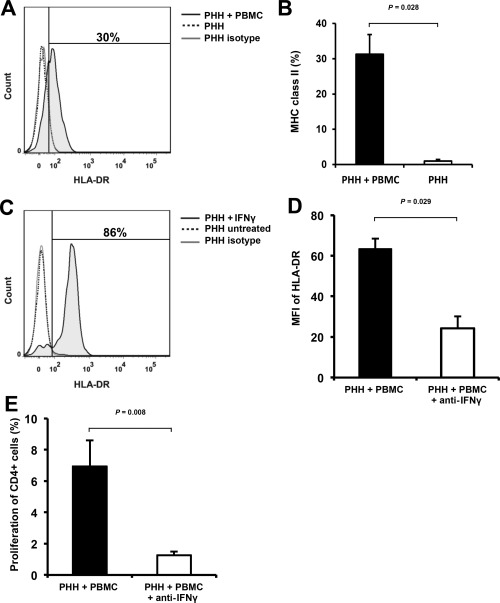
Evaluation of the role of IFNγ for hepatocyte‐induced proliferative alloresponses in MLHC. (A) Representative histogram of MHC class II surface receptor expression (HLA‐DR) on PHH retrieved from MLHC after 10 days (indicated as percentage expression) versus controls. (B) Bar chart summarizing MHC class II expression on PHH (n = 6, represented as mean ± SEM). (C) Representative histogram depicting the effect of IFNγ treatment on MHC class II expression on PHH (indicated as percentage expression). (D) Bar chart summarizing the effect of blocking anti‐IFNγ antibody (0.5 μg/mL) on MHC class II expression (indicated as MFI) on PHH in MLHC (n = 4, represented as mean ± SEM). (E) Bar chart summarizing proliferative responses of CD4+ cells in MLHC with/without supplementation of 0.5 μg/mL anti‐IFNγ antibody (n = 5, represented as mean ± SEM).
