Figure 5.

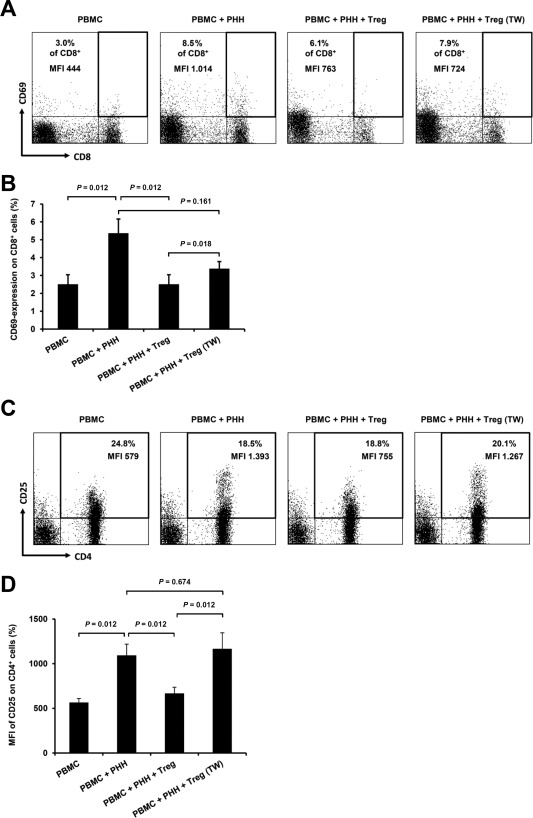
Flow cytometric analyses of early activation markers CD69 and CD25 on T cells in the early phase of MLHC. (A) Representative dot‐plots of flow cytometric analyses depicting CD69 surface expression on CD8+ T cells on day 3 of MLHC for different experimental groups (percentage of marker expression and MFI are indicated). (B) Bar chart summarizing percentage of CD69 expression on CD8+ T cells for different experimental groups (n ≥ 20, represented as mean ± SEM). (C) Representative dot‐plots of flow cytometric analyses depicting CD25 surface expression on CD4+ T cells on day 3 of MLHC for different experimental groups (percentage of marker expression and MFI are indicated). (D) Bar chart summarizing MFI of CD25 expression on CD4+ T cells for different experimental groups (n ≥ 20, represented as mean ± SEM).
