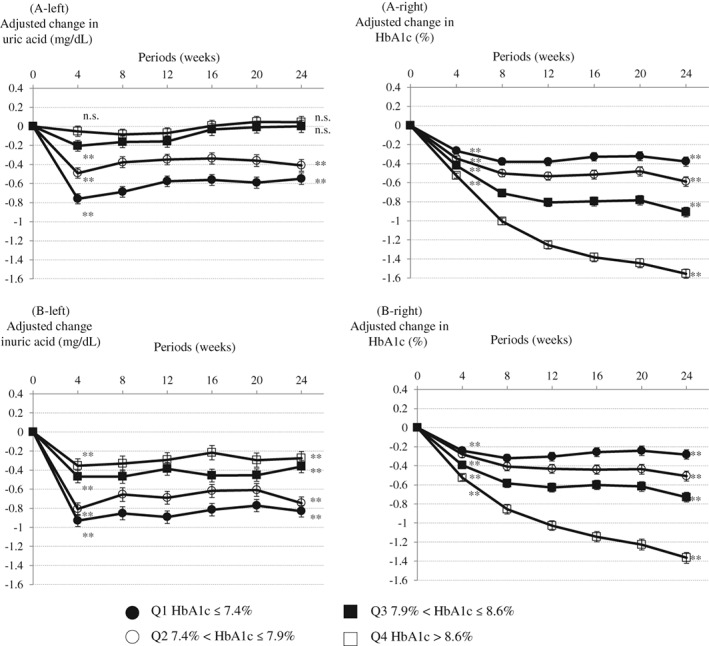
Figure 1.

Change in glycosylated haemoglobin (HbA1c) levels (right panels) and uric acid levels (left panels) from baseline until Week 24 in patients receiving tofogliflozin. A, Men. B, Women. Least squares mean (standard error) (last observation carried forward [LOCF]). Analysis of covariance (ANCOVA) between groups. **P < .001, n.s.; not significant one sample t‐test vs baseline. Adjusted with baseline uric acid and estimated glomerular filtration rate (eGFR) as covariates for change in uric acid. Adjusted with baseline eGFR as a covariate for change in HbA1c
