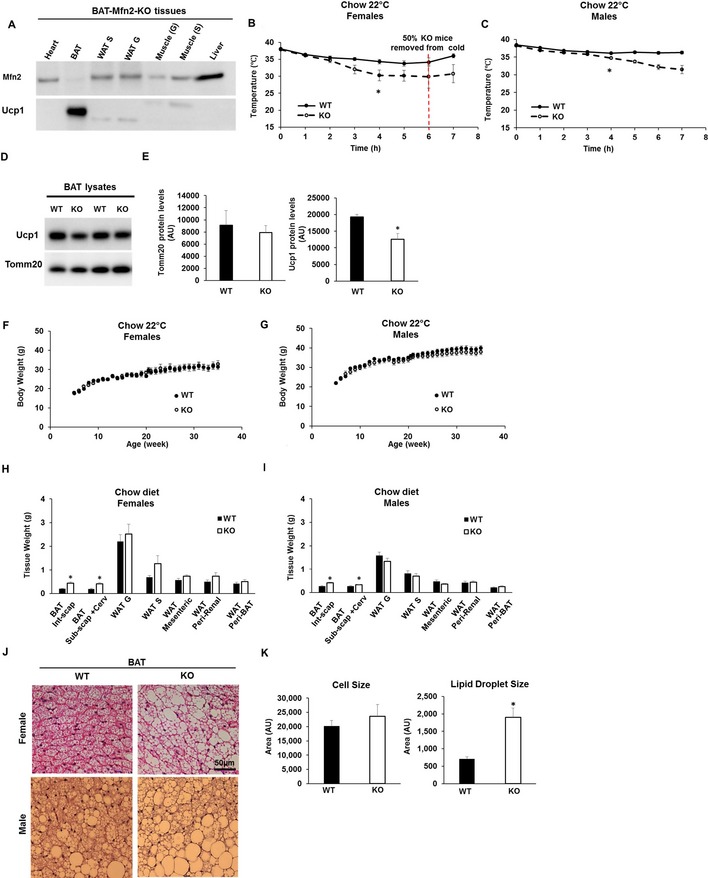
Representative Western blot measuring Mfn2 and Ucp1 in total lysates from different tissues of BAT‐Mfn2‐KO (KO) male mice. WAT S, subcutaneous white adipose tissue; WAT G, perigonadal white adipose tissue. Soleus muscle (S), Gastrocnemius muscle (G).
Body temperature measurements before and during cold exposure (4°C) of n = 7–9 control and BAT‐Mfn2‐KO female mice per group at 9 months old and fed a chow diet. Values shown are means ± SEM. * represents significance using two‐way ANOVA test WT vs. KO, P < 0.05.
Body temperature measurements before and during cold exposure (4°C) of n = 13–19 control and BAT‐Mfn2‐KO male mice per group at 9 months old and fed a chow diet. Values shown are means ± SEM. * represents significance using two‐way ANOVA test WT vs. KO, P < 0.05.
Representative Western blot measuring Ucp1 and Tomm20 (mitochondrial loading control) in BAT total lysates from control (WT) and BAT‐Mfn2‐KO (KO) female mice.
Protein level quantification of Tomm20 and Ucp1 levels per microgram of protein loaded. Bars represent average of Tomm20 and Ucp1 levels from n = 4–5 mice per group ± SEM. * represents significance using Student's t‐test, unpaired P < 0.05.
Body weight measurements of n = 7–9 control and BAT‐Mfn2‐KO female mice per group under chow diet over 38 weeks. Values shown are average ± SEM. Two‐way ANOVA test, P > 0.05.
Body weight measurements of n = 13–19 control and BAT‐Mfn2‐KO male mice per group under chow diet over 38 weeks. Values shown are average ± SEM. Two‐way ANOVA test, P > 0.05.
Quantification of the various WAT and BAT depot weights of n = 4–6 control (WT) and BAT‐Mfn2‐KO (KO) female mice (14–15 months old) per group on chow diet. Bar graphs represent average ± SEM. * represents significance using Student's t‐test, unpaired, P < 0.05.
Quantification of the various WAT and BAT depot weights of n = 13–19 control (WT) and BAT‐Mfn2‐KO (KO) male mice (14–15 months old) per group on chow diet. Bar graphs represent average ± SEM. * represents significance using Student's t‐test, unpaired, P < 0.05.
Representative images of H&E staining of the BAT sections isolated from control (WT) and BAT‐Mfn2‐KO (KO) female and male mice.
Quantification of the brown adipocyte cell size (n = 15–25 cells) and lipid droplet size (n = 124–250 lipid droplets) from the BAT isolated from n = 3–5 control (WT) and BAT‐Mfn2‐KO (KO) male mice per group. Values shown are average ± SEM and are expressed as arbitrary units. * represents significance using Student's t‐test, unpaired P < 0.05.