-
A–C
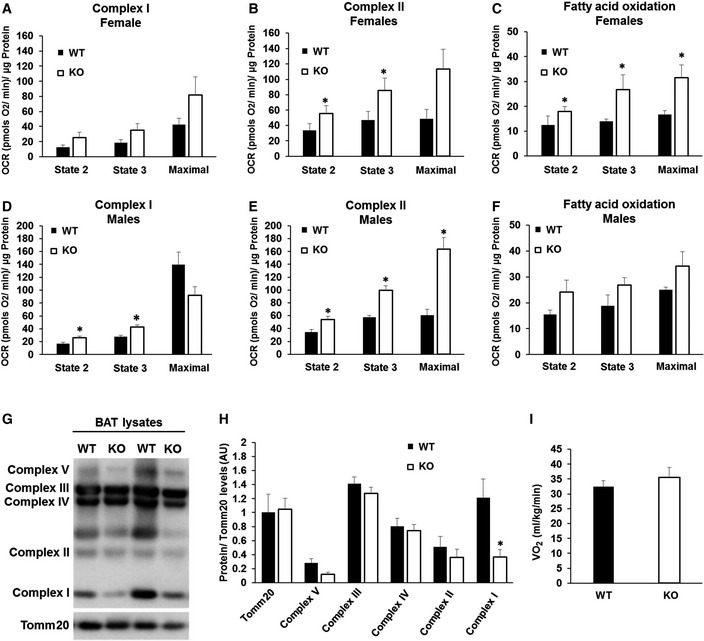
Quantification of oxygen consumption rates (OCR) in BAT isolated mitochondria from wild type (WT) and BAT‐Mfn2‐KO female mice under chow diet under the different respiratory states. State 2 quantifies respiration driven by proton leak (no‐ATP synthesis), state 3 quantifies respiration linked to maximal ATP synthesis, and maximal represents maximal electron transport chain activity induced by FCCP. Bar graphs represent average ± SEM for complex I‐driven respiration (pyruvate–malate, n = 4–5 mice per group) (A), complex II‐driven respiration (succinate−rotenone, n = 4–5 mice per group) (B), and fatty acid oxidation (palmitoyl carnitine−malate, n = 3 mice per group) (C). * represents significance using Student's t‐test, unpaired P < 0.05.
-
D–F
Quantification of OCR in BAT isolated mitochondria from wild type (WT) and BAT‐Mfn2‐KO male mice under chow diet under the different respiratory states. State 2 quantifies respiration driven by proton leak (no‐ATP synthesis), state 3 quantifies respiration linked to maximal ATP synthesis, and maximal represents maximal electron transport chain activity induced by FCCP. Bar graphs represent average ± SEM for complex I‐driven respiration (pyruvate–malate, n = 13–19 mice per group) (D), complex II‐driven respiration (succinate−rotenone, n = 13–19 mice per group) (E), and fatty acid oxidation (palmitoyl carnitine−malate, n = 2–8 mice per group) (F). * represents significance using Student's t‐test, unpaired P < 0.05.
-
G
Respiratory complex expression levels: Representative Western blot measuring complex I subunit Ndufb8, complex II Sdhb, complex III Uqcrc2, complex IV Cox1, complex V Atp5a, and outer mitochondrial membrane protein Tomm20 in BAT total lysate from wild type (WT) and BAT‐Mfn2‐KO female mice.
-
H
Quantification of the five complex subunits normalized by Tomm20 level measured as shown in (G). Bar graphs represent average ± SEM of Tomm20 expression values and complexes normalized to Tomm20 from n = 5–7 mice per group of wild type (WT) and BAT‐Mfn2‐KO female mice. * represents significance using Student's t‐test, unpaired P < 0.05.
-
I
Oxygen consumption measurements in WT and BAT‐Mfn2‐KO anesthetized females under a chow diet 30 min after injection with the β3‐agonist CL‐316,243 (1 mg/kg). Bars represent average ± SEM of VO2 (ml/kg/min) consumed n = 4–7 mice per group.