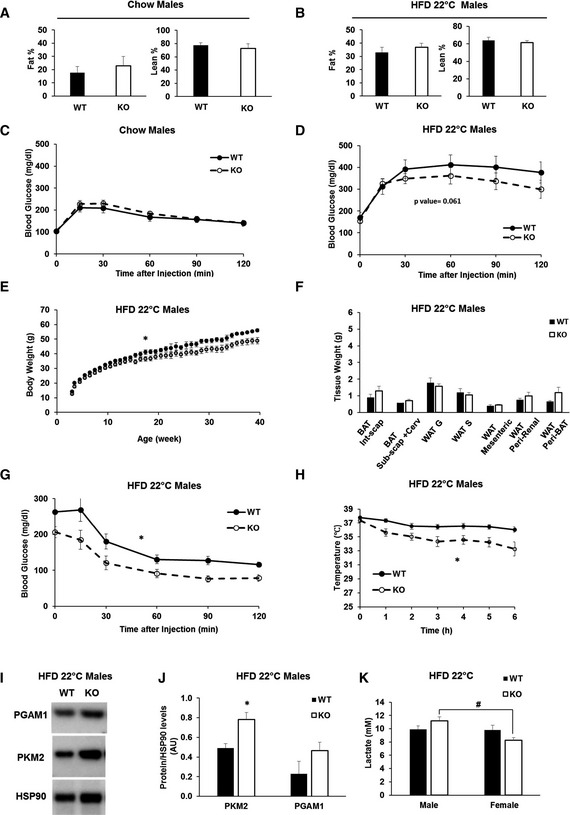
Body composition of n = 8–9 wild type (WT) and BAT‐Mfn2‐KO (KO) male mice (7 months) per group on chow diet. Bar graph represent average of % fat and % lean mass of total body weight ± SEM.
Body composition of n = 4–6 wild type (WT) and BAT‐Mfn2‐KO (KO) male mice (7 months) per group on a HFD at ambient temperature (22°C). Bar graph represent average of % fat and % lean mass of total body weight ± SEM.
Glucose tolerance test (GTT) on n = 11–16 wild type (WT) and BAT‐Mfn2‐KO (KO) male mice per group at 5 months old, fed chow diet. Values shown are average ± SEM.
GTT on n = 10–13 wild type (WT) and BAT‐Mfn2‐KO (KO) male mice per group, fed a HFD at 22°C. Values shown are average ± SEM. Two‐way ANOVA test, WT vs. KO, P < 0.05.
Body weight measurements of n = 8–9 wild type (WT) and BAT‐Mfn2‐KO (KO) male mice per group on HFD at an ambient temperature of 22°C (room temperature, RT) over 40 weeks. Values shown are average ± SEM. Two‐way ANOVA test, WT vs. KO, *P < 0.05.
Quantification of WAT and BAT deposit weight isolated from n = 4–6 wild type (WT) and BAT‐Mfn2‐KO (KO) male mice per group fed a HFD at ambient temperature (22°C). Bar graphs represent average ± SEM. * represents significance using Student's t‐test, unpaired P < 0.05.
Insulin tolerance tests (ITT) on n = 9–13 wild type (WT) and BAT‐Mfn2‐KO (KO) male mice per group, fed a HFD at ambient temperature (22°C). Values shown are average ± SEM. Two‐way ANOVA test, WT vs. KO, *P < 0.05.
Body temperature measurements of wild type (WT) and BAT‐Mfn2‐KO (KO) male (n = 10–12) mice at 9 months old in HFD groups at ambient temperature. Values shown in both panels are means ± SEM. * represents significance using two‐way ANOVA test, WT vs. KO, P < 0.05.
Representative Western blot measuring PGAM1, PKM2, and HSP90 in BAT total lysates from wild type (WT) and BAT‐Mfn2 KO (KO) males on HFD.
Protein level quantification of PGAM1 and PKM2 normalized by HSP90 level, used as loading control. Bar graphs represent average ± SEM of proteins normalized to HSP90 from n = 3–4 mice per group of wild type (WT) and BAT‐Mfn2‐KO (KO) male mice. * represents significance using Student's t‐test, unpaired P < 0.05.
Quantification of serum lactate from n = 3–6 male and n = 4–8 female mice per group of wild type (WT) and BAT‐Mfn2‐KO (KO) mice. Bar graphs represent average ± SEM of serum lactate (mM). # represents significance between male KO and female KO groups using Student's t‐test, unpaired P < 0.05.