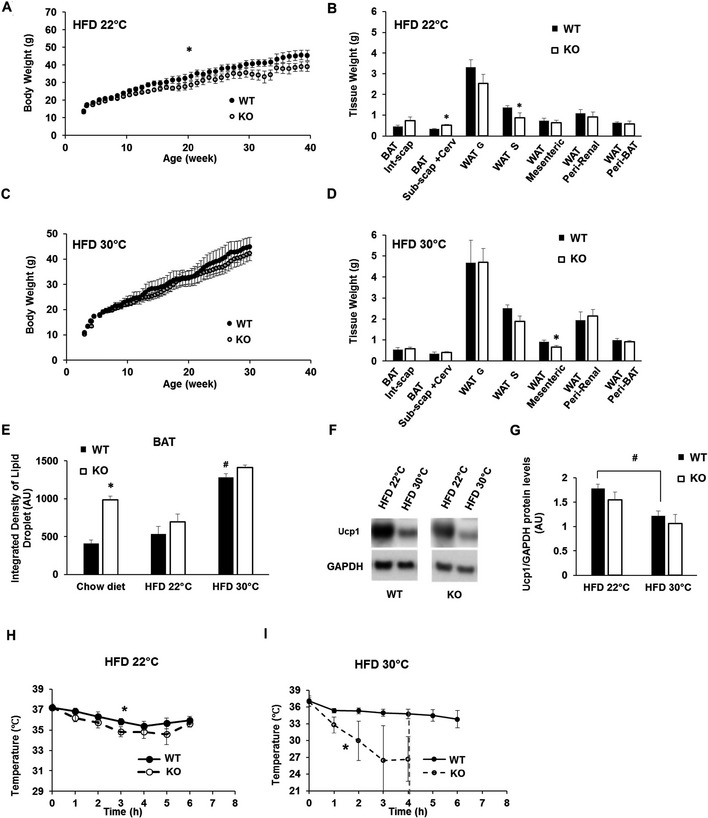
Body weight measurements of n = 8–10 wild type (WT) and BAT‐Mfn2‐KO (KO) female mice per group on HFD at an ambient temperature of 22°C (room temperature, RT) over 40 weeks. Values shown are average ± SEM. Two‐way ANOVA test, WT vs. KO,* P < 0.05.
Quantification of WAT and BAT depots weight isolated from n = 4–8 wild type (WT) and BAT‐Mfn2‐KO (KO) female mice per group fed a HFD at ambient temperature (22°C). Bar graphs represent average ± SEM. * represents significance using Student's t‐test, unpaired P < 0.05.
Body weight measurements of n = 5–7 wild type (WT) and BAT‐Mfn2‐KO (KO) female mice per group fed a HFD at thermoneutrality (30°C) over 30 weeks. Values shown are average ± SEM. No significant differences detected. Two‐way ANOVA test, WT vs. KO.
Quantification of WAT and BAT depots weight of n = 5–7 wild type (WT) and BAT‐Mfn2‐KO (KO) female mice per group fed a HFD at thermoneutrality (30°C). Bar graphs represent average ± SEM. * represents significance using Student's t‐test, unpaired P < 0.05.
Quantification of the lipid droplet integrated density from the BAT isolated from wild type (WT) and BAT‐Mfn2‐KO (KO) female mice fed a chow diet (n = 5) or a HFD at either 22°C (n = 5–6) or 30°C (n = 4–8). Values shown are average ± SEM. * represents significance WT vs. KO using Student's t‐test, unpaired P < 0.05. # represents significance WT chow diet vs. WT HFD 30°C using Student's t‐test, unpaired P < 0.05.
Representative Western blot measuring Ucp1 and GAPDH (mitochondrial loading control) in BAT total lysates from wild type (WT) and BAT‐Mfn2‐KO (KO) female mice fed a HFD at 22°C or at 30°C.
Protein level quantification of Ucp1 protein levels normalized to GAPDH. Bars represent average of Ucp1/GAPDH from n = 3–4 mice per group ± SEM. # represents significance using Student's t‐test, unpaired HFD 22°C vs. 30°C P < 0.05.
Body temperature measurements before and during cold exposure (4°C) of wild type (WT) and BAT‐Mfn2‐KO (KO) female (n = 7–11 mice per group), at 9 months old, fed a HFD at ambient temperature. Values shown in both panels are means ± SEM. * represents significance using two‐way ANOVA test, WT vs. KO, P < 0.05.
Body temperature measurements before and during cold exposure (4°C) of wild type (WT) and BAT‐Mfn2‐KO (KO) female mice (n = 5–7 mice per group), at 9 months old, fed a HFD at thermoneutral temperature. Values shown in both panels are means ± SEM. * represents significance using two‐way ANOVA test, WT vs. KO, P < 0.05. Red dotted line: At this time point all the KO mice were removed from the cold room due to severe cold intolerance.