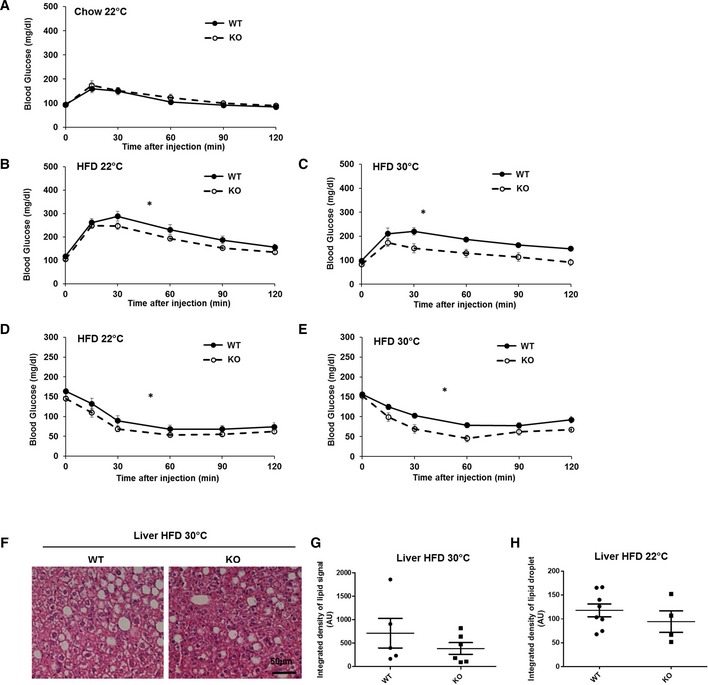
Glucose tolerance test (GTT) on n = 5–7 wild type (WT) and BAT‐Mfn2‐KO (KO) female mice per group at 5 months old, fed chow diet.
GTT on n = 10 wild type (WT) and BAT‐Mfn2‐KO (KO) female mice per group, fed a HFD at 22°C.
GTT on n = 5–7 wild type (WT) and BAT‐Mfn2‐KO (KO) female mice per group, fed a HFD at thermoneutral temperature (30°C).
Insulin tolerance tests (ITT) on n = 8–10 wild type (WT) and BAT‐Mfn2‐KO (KO) female mice per group, fed a HFD at 22°C.
ITT on n = 5–7 wild type (WT) and BAT‐Mfn2‐KO (KO) female mice per group, fed a HFD at thermoneutral temperature (30°C). Glucose injection was required due to hypoglycemia 60 min after insulin injection to some BAT‐Mfn2‐KO mice.
Representative images of H&E staining of the liver sections isolated from wild type (WT) and BAT‐Mfn2‐KO (KO) female mice, fed a HFD at thermoneutrality (30°C).
Quantification of the integrated density of lipid droplet signal in liver sections from n = 5–6 wild type (WT) and BAT‐Mfn2‐KO (KO) female mice per group fed a HFD at thermoneutrality. Each dot represents a mouse and values shown are expressed as arbitrary units. Values shown are average ± SEM. Student's t‐test, unpaired P > 0.05.
Quantification of the integrated density of lipid droplet signal in liver sections from n = 4–8 wild type (WT) and BAT‐Mfn2‐KO (KO) female mice per group fed a HFD at 22°C. Each dot represents a mouse and values shown are expressed as arbitrary units. Values shown are average ± SEM. Student's t‐test, unpaired P > 0.05.
Data information: Values in panels (A–E) are average ± SEM. * represents significance using two‐way ANOVA test,
< 0.05.