
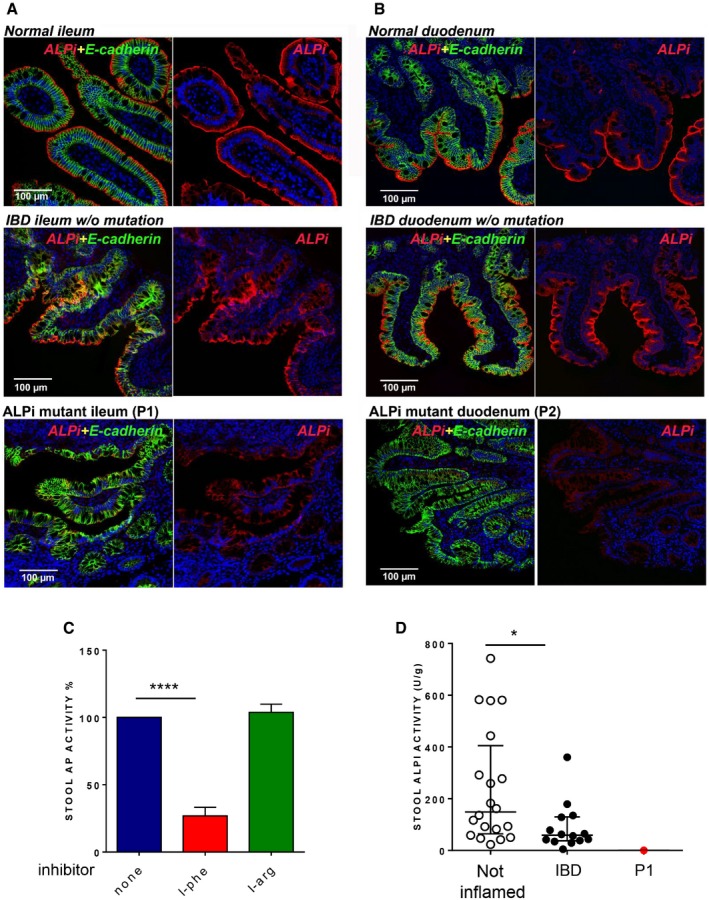
Figure 4. Reduced ALPI expression in patients’ small intestinal biopsies.
-
A, BImmunofluorescence microscopy of duodenum (A) and ileum (B) sections from Patient 1 (A) and Patient 2 (B) compared to normal or IBD controls. Sections were stained with DAPI (4′,6‐diamidino‐2‐phenylindole) for DNA (blue) and antibodies against ALPI alone (second column, red) or ALPI and E‐cadherin (green) (first column, merge staining). Magnification 20× (scale bar = 100 μm).
-
CEffect of AP inhibitors (L‐phe, L‐arg) on AP activity in stools of non‐inflamed controls (n = 20). Data are expressed as mean ± SD. ****P < 0.0001, nonparametric, unpaired two‐tailed Mann–Whitney test.
-
DALPI activity in stools of non‐inflamed (n = 20) or IBD controls (n = 14) and of P1. AP values are expressed as units of ALPI/g stool and as medians with interquartiles; *P = 0.0122, nonparametric, unpaired two‐tailed Mann–Whitney test.