
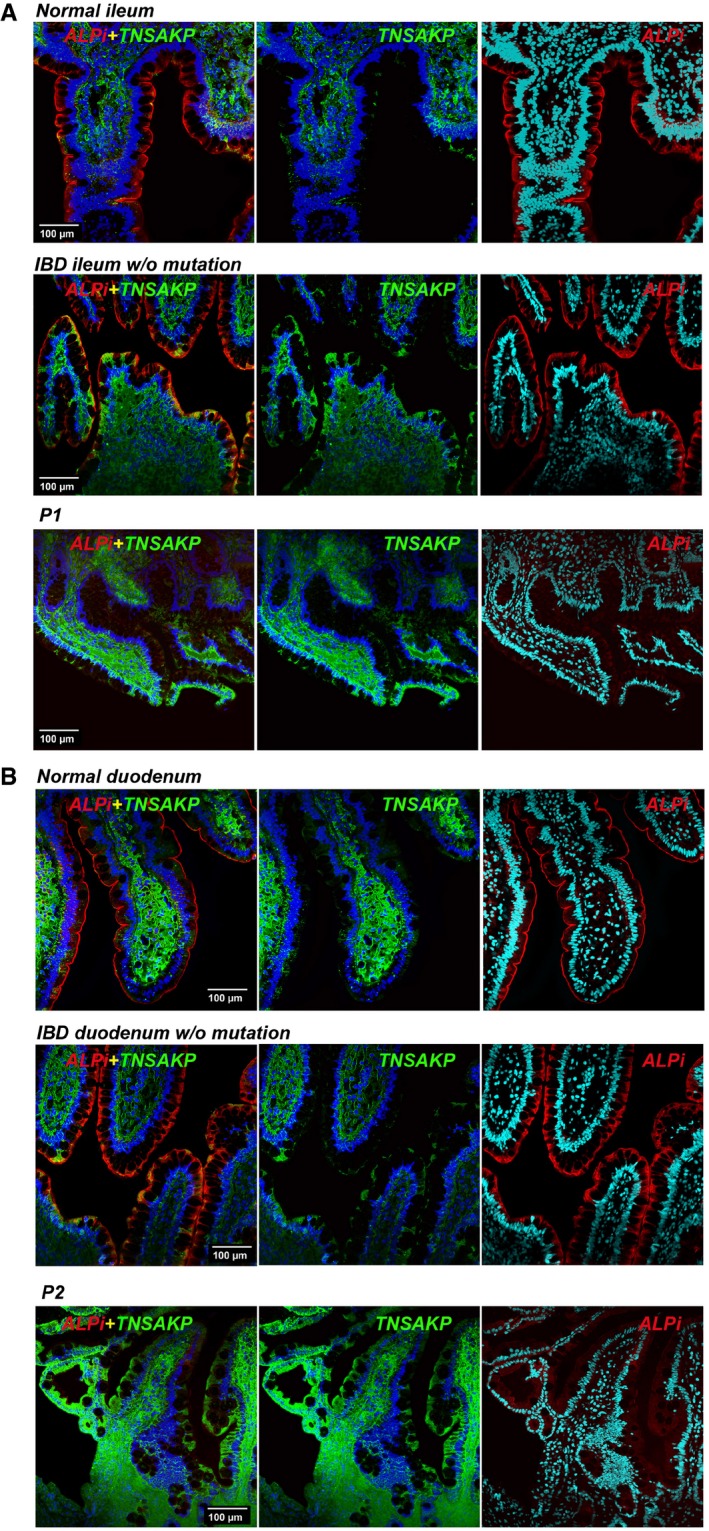
Figure EV4. TNAP expression in patients' small intestinal biopsies.
-
A, BImmunofluorescence microscopy of duodenum (A) and ileum (B) sections from P1 (A) and P2 (B) compared with normal or IBD controls. Sections were counterstained with blue RedDot2 dye for DNA and antibodies against ALPI alone (red), TNAP alone (green) or TNAP and ALPI (first column, merge staining). Magnification 20× (Scale bars: 100 μm).